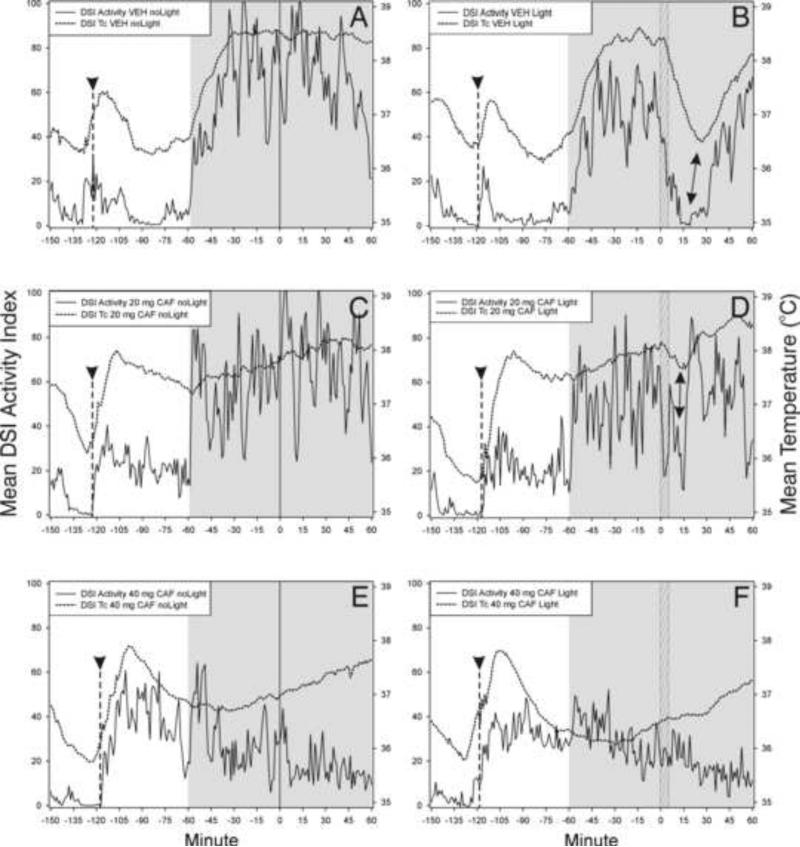
Figure 7.
Caffeine (CAF; 40 mg) treatment blocks (panel F) both light-induced locomotor suppression and the associated drop in Tc; 20 mg has a partial effect (panel D; double-ended arrows) compared to the effect of vehicle (VEH; panel B). Arrowhead and dashed vertical line - approximate time of VEH (panels A,B) or CAF (panels C-F) injection; shaded area - early dark phase (ZT12-ZT14). The light pulse was administered for 5 min beginning at minute 0 (ZT13; hatched vertical bar, panels B,D,F). Dotted data line - Tc obtained with DSI transmitters; solid data line - DSI activity index. N=9-11/group.

