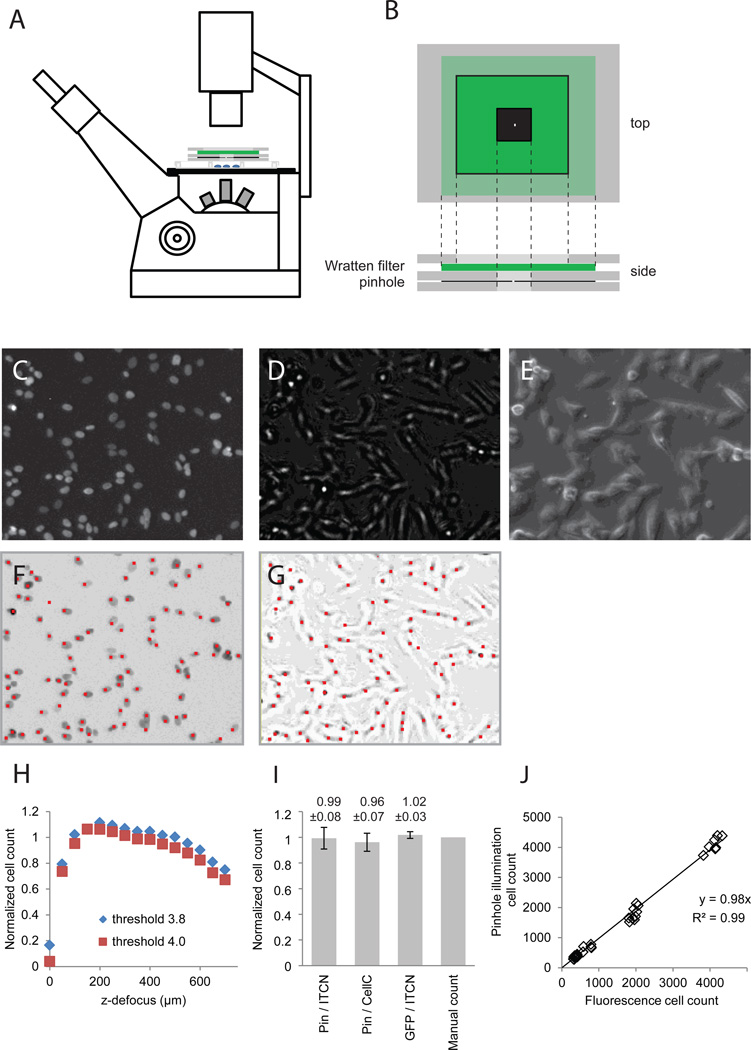
Figure 1. Cell counting from pinhole illuminated microscopy.
(A) A pinhole aperture and a green Wratten filter were placed on top of the cell culture plate and positioned to ensure an even illumination of the viewing field; (B) enlarged view of the filter-pinhole assembly. SHEP-GFP cells were seeded at 50 – 500k / well in a 12-well plate and grown for 2 days with a media switch after 24 hours. Panels (C–G) show enlarged sections of images recorded in parallel at 4× magnification: (C) GFP fluorescence, (E) Pinhole illuminated bright field image, (F) phase contrast image. (G) Cell identification from fluorescence images and pinhole illuminated bright-field images calculated by the ImageJ ITCN plugin; red sports mark identified cells. Cell markers were enlarged 400% to improve readability. (H) Cell counts from pinhole images recorded at different focal positions normalized against counts from fluorescence images. (I) Comparison of cell counts from fluorescence and pinhole images analyzed by manual and automated counting (means ± SD, n = 9). (J) Pinhole cell counts plotted against counts from GFP fluorescence fitted by linear regression.

