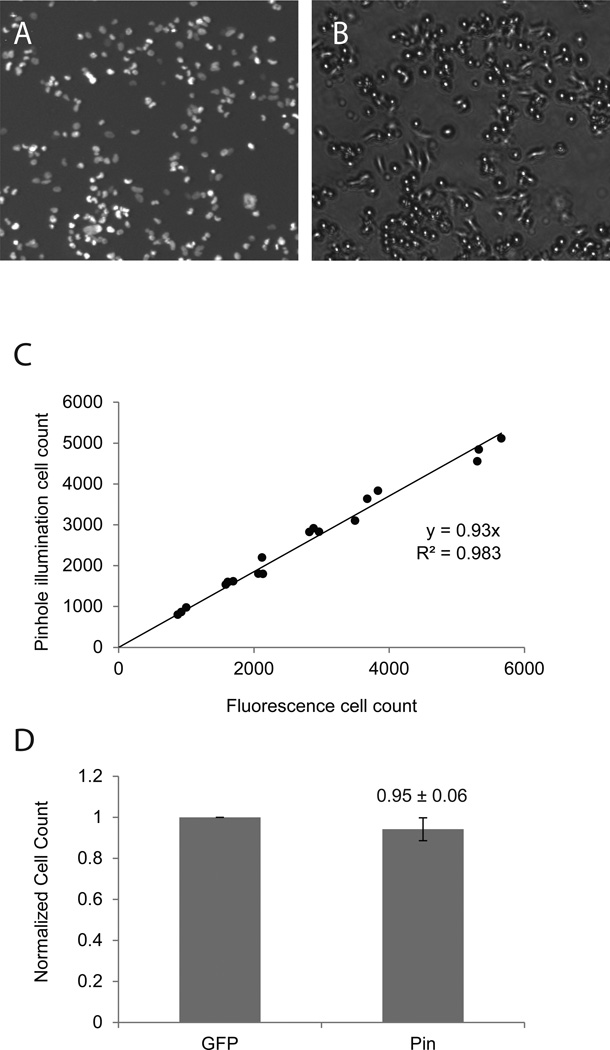
Figure 3. Counting of freshly seeded cells.
SHEP-GFP cells were seeded at 100k – 1000k / well and were allowed to attach to the bottom of a 12-well plate for approximately 3 hours. Fluorescence- (A) and pinhole-illuminated bright field images (B) were taken in identical viewing fields of the freshly seeded cells. (C) Fluorescent and pinhole counts were plotted against one another and fitted by linear regression. (C) Normalized cell counts for corresponding fluorescent and pinhole images (means ± SD, n = 18).

