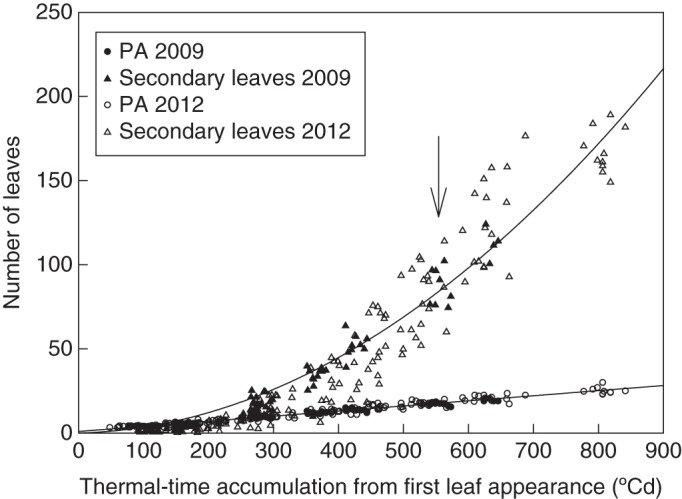
Fig. 2.

Numbers of primary and total number of secondary leaves as a function of thermal time expressed in cumulative degree-days from first leaf appearance during the growth phases of expt 1. The regressions were estimated for all data on the plot (y = 0·0003x2 – 0·0275x, n = 207, r2 = 0·91 for secondary leaves; same fit as Fig. 1 for primary leaves). The arrow indicates the early bloom stage. PA, primary axis.
