
Fig. 6.
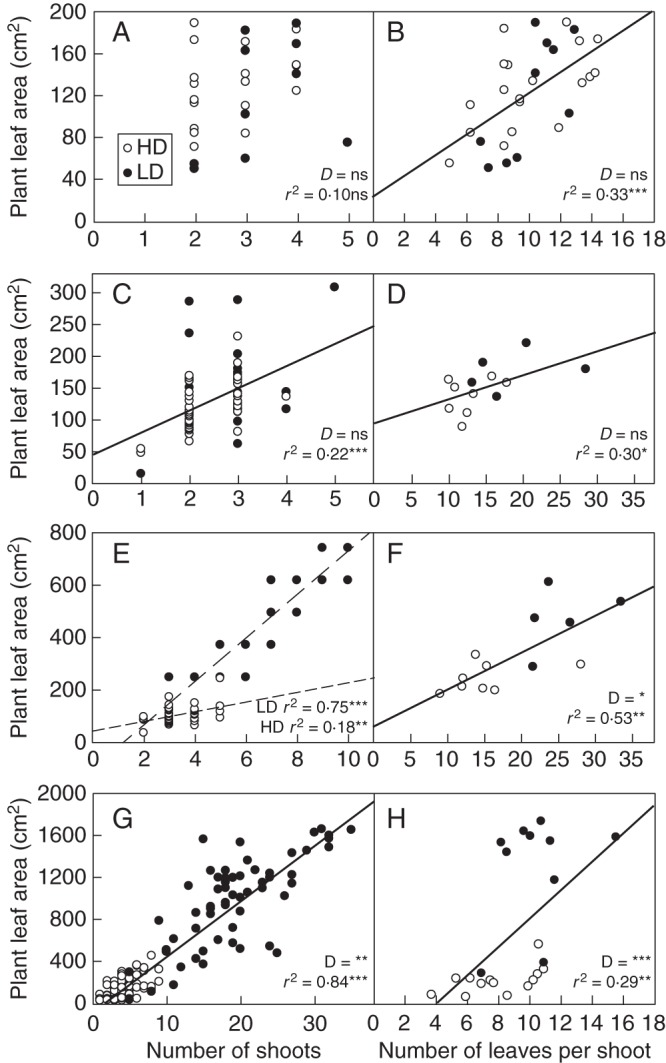
Relationships between plant leaf area and the shoot number (left), and plant leaf area and the number of leaves per shoot (right) in the four situations studied during exp. 2: (A, B) PSG, pure stand growth; (C, D) MRG, mixed stand growth; (E, F) MSR, mixed stand regrowth; and (G, H) PSR, pure stand regrowth. High (HD) and low density (LD) are as indicated in the key in (A). ANCOVA results are presented in each panel: two lines in the case of an interaction between the categorical independent variable (i.e. density) and the continuous variable, no line in the case of a non-significant effect of the continuous variable, and a single line in the case of a significant effect of the continuous variable without any interaction. In the absence of interaction, D indicates the level of significance of the categorical independent variable (*P < 0·05; **P < 0·01; ***P < 0·001; ns, not significant). r2 indicates the coefficient of determination of the regression in the case of a significant effect of the continuous variable.