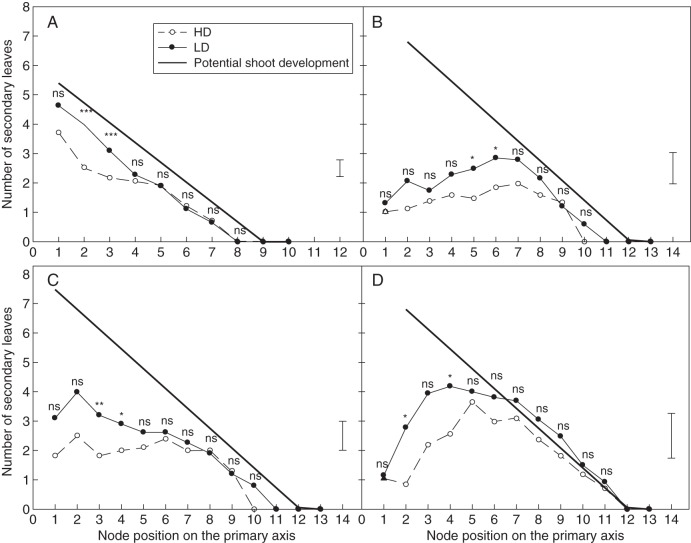
Fig. 8.
Number of secondary leaves at each node position on high (HD) and low density (LD) plants in the four situations studied during expt 2: (A) PSG, pure stand growth; (B) PSR, pure stand regrowth; (C) MSG, mixed stand growth; and (D) MSR, mixed stand regrowth. Shoots were selected at a given stage of development in each situation (shoots with 12–14 primary leaves). The dotted line represents the number of secondary leaves predicted by the potential shoot development model [eqns (3–6)]. P-values indicate the results of the t-test for a comparison between LD and HD at each node position (*P < 0·05; **P < 0·01; ***P < 0·001; ns, not significant).

