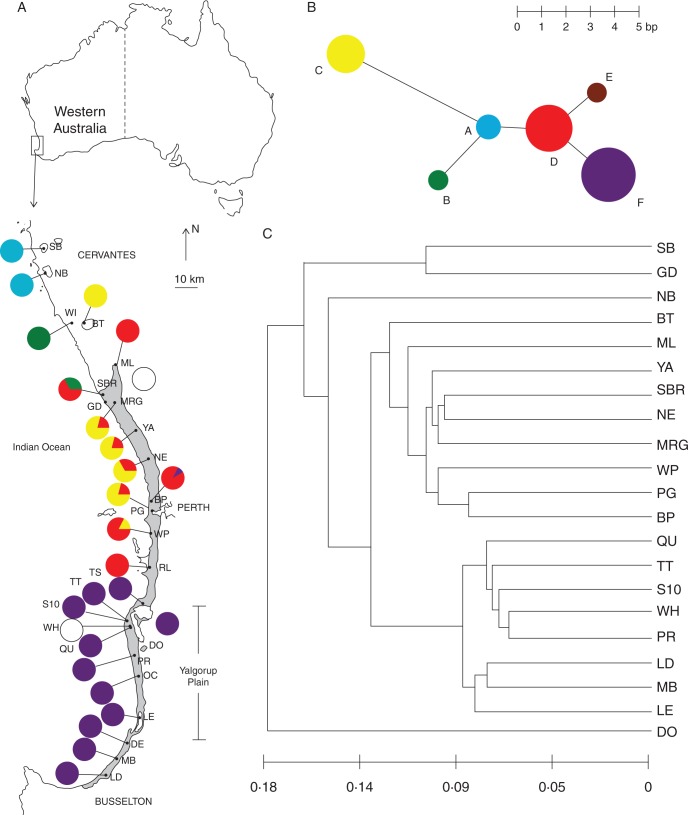
Fig. 1.
Study location and genetic analyses for Eucalyptus gomphocephala. (A) Geographic distribution of chloroplast microsatellite haplotypes. White circles indicate populations for which chloroplast data are not available. Section sizes are proportional to the number of individuals displaying that haplotype. Grey shading indicates the distribution of E. gomphocephala (map source Government of Western Australia, 2003). (B) Statistical parsimony tree of haplotypes based on four chloroplast microsatellites. Circle sizes indicate relative haplotype frequencies. Haplotypes present in ≤12 individuals are represented with a circle of the same size. Branch length indicates the number of nucleotides between haplotypes. (C) UPGMA phenograms of the relationship between populations based on nuclear SSR data. The scale bar represents Nei's (1972) genetic distance.

