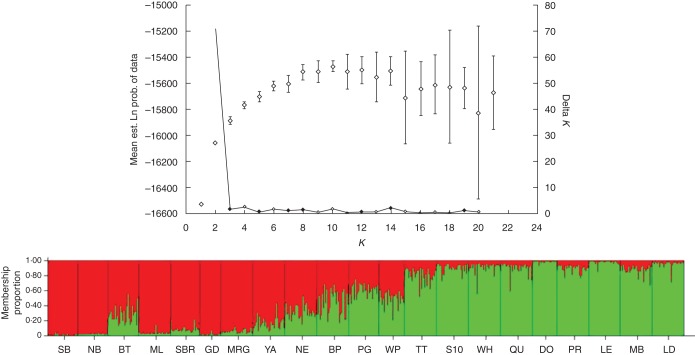
Fig. 2.
The estimated membership proportions of sampled Eucalyptus gomphocephala individuals at each site in the two genetic clusters inferred with STRUCTURE (Pritchard et al., 2000) based on nuclear SSR data. Top: Structure Harvester – Delta K peaks at K = 2. Bottom: bar chart of relative proportional membership of each individual (single bars) within each sampling location/population (solid lines) to one of two genetic clusters (red, green).

