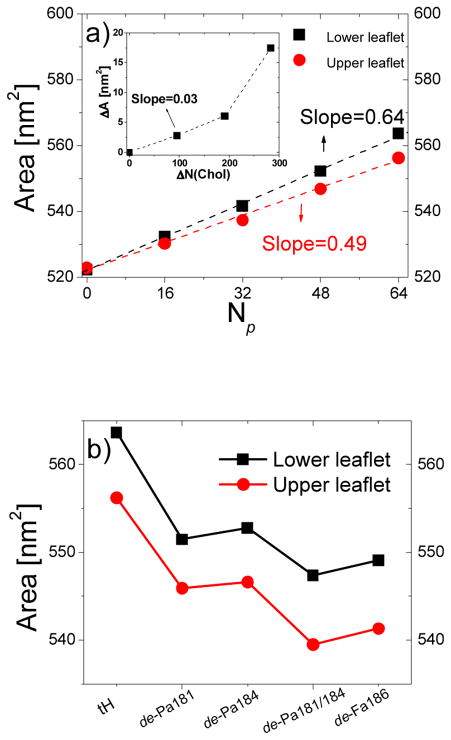
Fig. 7.
Monolayer surface area. (a) Monolayer surface area increase due to insertion of different numbers of tH molecules at the lower leaflet. Inset: the corresponding monolayer surface area. (b) Monolayer surface area increase due to insertion of the same number of peptides that have different lipid modifications. Errors were calculated as described in Fig. 3 and within the range of the symbols.

