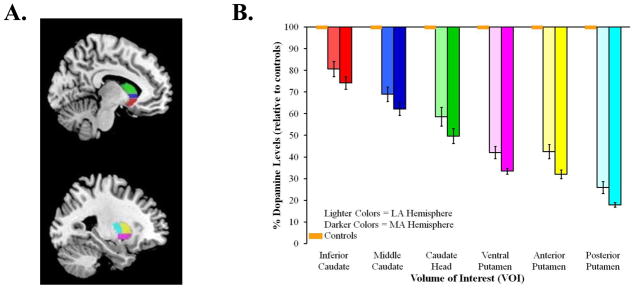
Figure 1.

(A.) Striatal VOIs overlaid on an MNI template: anteroventral striatum (red), middle caudate (blue), caudate head (green), ventral putamen (pink), dorsal anterior putamen (yellow) and dorsal posterior putamen (light blue). (B.) Mean percent decrease of dopaminergic binding potential, relative to controls, for the most (MA) and least (LA) affected hemispheres of the six VOIs. Orange boxes represent age-matched controls; error bars for controls are indistinguishable from the x-axis. Standard error bars represent standard error of the mean (SEM).
