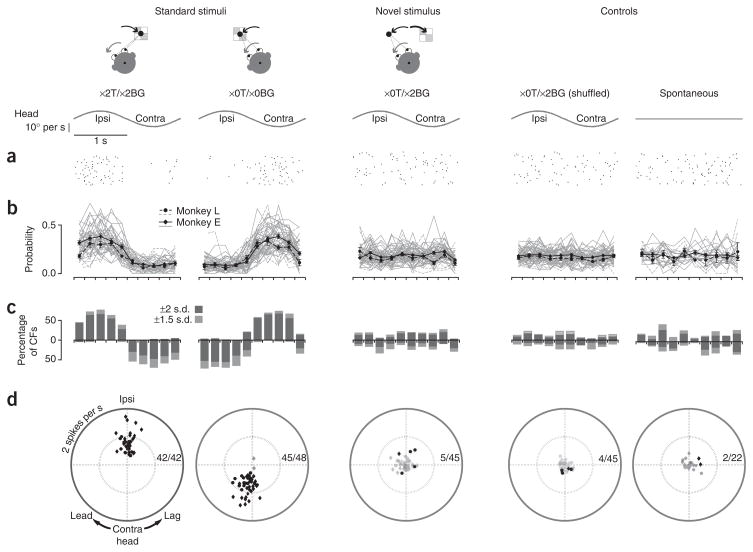
Figure 2.
Climbing fiber responses to standard and novel training stimuli. (a) Rasters of activity in a single climbing fiber during ~35 cycles of the standard visual-vestibular training stimuli (left), with coherent motion of a visual target (T) and background (BG) during the head movement; or a novel training stimulus (middle), with opposite motion of T and BG (×0T/×2BG). Right, spike trains generated by randomly shuffling interspike intervals measured during the ×0T/×2BG stimulus and spontaneous activity in the absence of head or image motion. (b) Probability of climbing fiber (CF) firing during 200-ms epochs of the stimuli in individual climbing fibers (gray lines) and the population of climbing fibers (black lines) recorded in monkeys L (circles) and E (diamonds). Error bars indicate s.e.m. (c) Percent of climbing fibers whose probability of firing was 1.5 (light gray) or 2 (dark gray) s.d. above or below spontaneous for each 200-ms epoch of the stimulus cycle. (d) Amplitude and phase of climbing fiber firing rate modulation. Distance from the origin represents the amplitude of a climbing fiber response and phase represents the timing of peak firing relative to head velocity. Responses significantly different from zero (P < 0.05) are represented by black symbols and the number of climbing fibers with significant responses out of the total recorded is noted on each plot. Climbing fiber responses with peak firing during ipsiversive head velocity, which are typically associated with VOR gain increases, are plotted above the horizontal axis. Clockwise rotation represents increased phase lead.

