Figure 3.
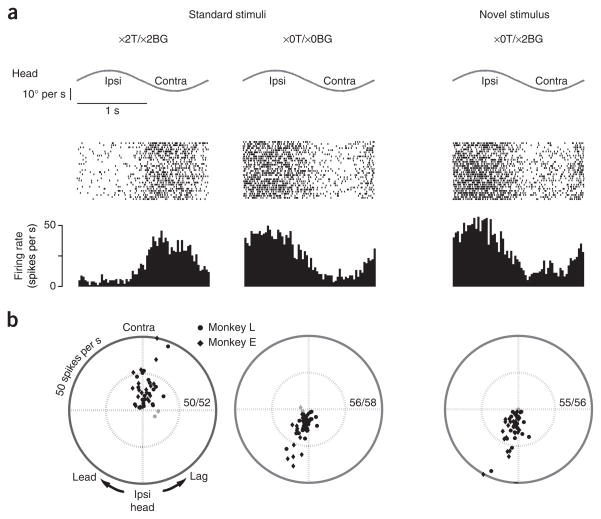
Purkinje cell simple spike responses during training. (a) Individual Purkinje cell. Rasters and peristimulus time histograms of simple spike activity, aligned on the onset of ipsiversive head movement. (b) Purkinje cell population. Polar plots summarizing the amplitude and phase of simple spike firing rate modulation in each Purkinje cell. Note that the axis is rotated, compared with Figure 2d, so that simple spike responses with peak activity during contraversive head velocity plot above the horizontal axis, as such responses are typically associated with increases in VOR gain. Black symbols represent responses that were significantly different from zero (P < 0.05).

