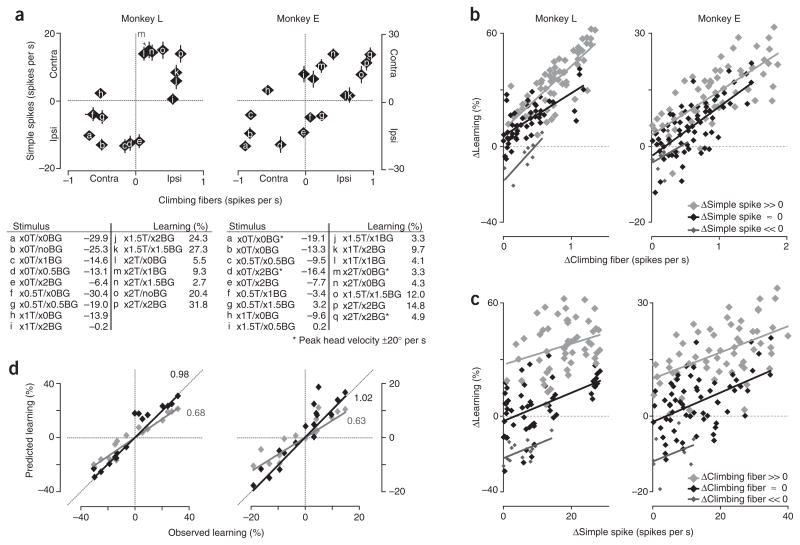
Figure 5.
Purkinje cell simple spike and climbing fiber signals together predict learned behavioral changes. (a) Different combinations of instructive signals. Each point represents the average climbing fiber response (abscissa) and simple spike response (ordinate) to one training stimulus. The letter on each symbol and the corresponding tables identify the training stimuli and the median percent change in VOR gain induced by each stimulus. Error bars represent s.e.m. (b) Climbing fiber responses were correlated with learning. Each data point represents the difference in climbing fiber responses (abscissa) and the difference in learning (ordinate) induced by one pair of training stimuli. The stimulus pairs are grouped into three bins, according to the difference in their simple spike responses (gray shades). (c) Purkinje cell simple spike responses were correlated with learning. Each data point represents the difference in simple spike responses and difference in learning for one pair of training stimuli. The stimulus pairs are grouped into three bins, according to the difference in their climbing fiber responses (gray shades). (d) Learning could be predicted from the climbing fiber and Purkinje cell simple spike responses during training. The changes in VOR gain predicted from the instructive signals carried by the climbing fibers alone (gray) or from a linear combination of climbing fiber and Purkinje cell simple spike instructive signals (black) are plotted against the observed changes in VOR gain induced by each training stimulus. The correlation coefficients for each fit are indicated.

