
Fig. 1.
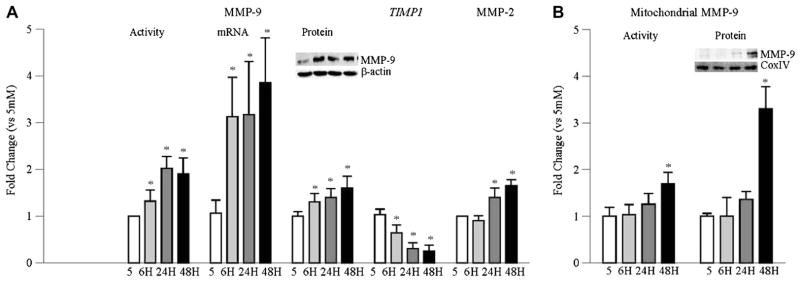
Time course of glucose-induced activation of MMP-9 and MMP-2 in retinal endothelial cells. MMP-9 activity was quantified in BRECs incubated in high glucose for 6– 96 h by in situ zymography, and the ratio of the active and the pro-active MMP-9 bands was plotted in the accompanying histogram. mRNA levels of MMP-9 and TIMP1 were quantified by real time qPCR. Protein expression of MMP-9 was determined by western blot technique. MMP-2 activity was performed by in situ zymography. (B) MMP-9 accumulation in mitochondria was assessed by western blot using Cox IV as loading control; the accompanying blot is representative of 3 different experiments. Its activity was assessed in 30–40 μg mitochondria fraction by fluorescence kit. Each measurement was performed in duplicate using cells from 3–5 different preparations, and the values are represented as mean ± SD 5 = 5 mM glucose; 6 h, 24 h, 48 h = 20 mM glucose treatment for 6 h, 24 h, and 48–96 h respectively.* p < 0.05 compared to 5 mM glucose.