
Fig. 2.
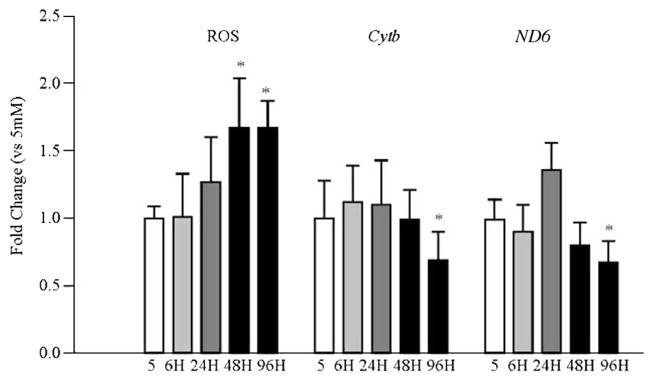
Temporal relationship between high glucose exposure and mitochondrial ROS and mtDNA encoded proteins in retinal endothelial cells. Mitochondrial ROS were quantified in BRECs incubated with MitoTracker Red at the end of the desired duration of high glucose insult. The resultant fluorescence was quantified at 579 nm excitation and 599 nm emission wavelengths. The transcripts of mtDNA-encoded proteins Cytb and ND6 were quantified by real time qPCR using β-actin as an internal control. Values are represented as mean ± SD obtained from 3–4 cells preparations, and each measurement is made at least in duplicate. *p < 0.05 compared with 5 mM glucose.