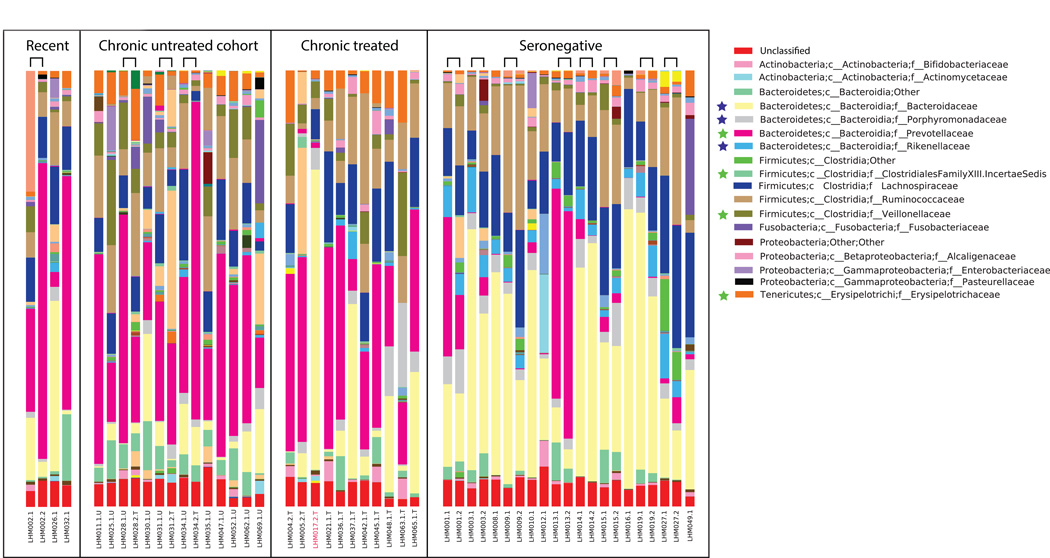
Fig. 2. Taxonomy bar charts showing dominance of Prevotellaceae in HIV infected subjects.
Families significantly different between ART naïve individuals chronically infected with HIV and HIV-negative controls are marked with a star (p<0.05 ANOVA with FDR correction, only the first time point was used for individuals who had multiple time points). Those enriched in HIV-negative have a blue star and in HIV (Chronic) in green. Samples from the same individual at two timepoints are adjacent and joined with a bridge. See Tables S2A, S2B, and S2C for lists of discriminatory genera, families, and 97% OTUs respectively and Fig. S2 for a phylogenetic tree relating discriminatory 97% OTUs.

