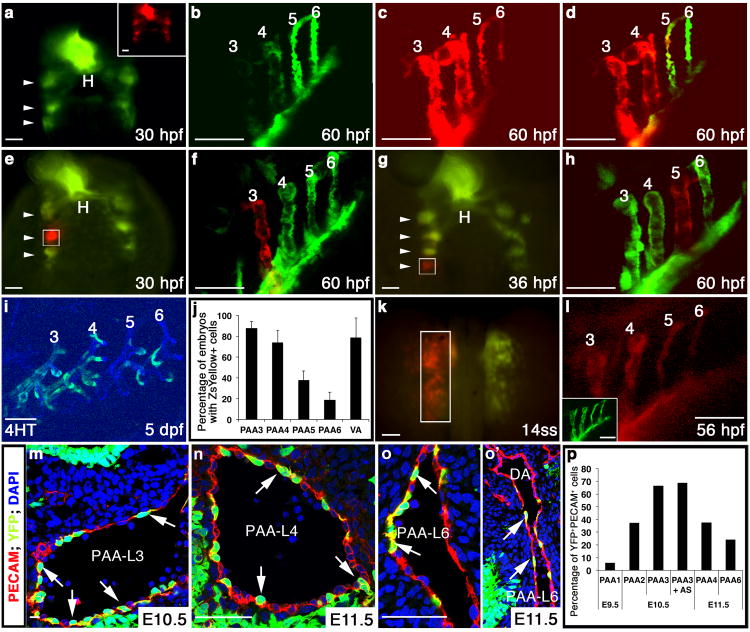
Figure 2. nkx2.5+progenitors give rise to PAA endothelium in zebrafish and mouse.
a-d, Tg(nkx2.5:Kaede) embryo at 30 hpf before (green) and after (red, inset) pan-photoconversion (n=3). Arrowheads highlight Kaede+ pharyngeal clusters. At 60 hpf, embryos were imaged in the green (b) and red (c) channels and these images were merged (d). e-h, Localized Kaede photoconversion of cluster 2 (e, white box, n=2) or 4 (g, white box, n=2) at the indicated developmental stages. Merged red and green images of the PAAs in the same embryos at 60 hpf are shown in (f) and (h). i, ZsYellow reporter fluorescence in PAAs 3-6 at 5 dpf in a Tg(nkx2.5:CreERT2); Tg(kdrl:CSY) embryo treated with 4HT from 10-13 hpf. j, Graph showing the average percentages of embryos with ZsYellow+ reporter fluorescence in each PAA and the VA across four experimental repliates (n=160). Error bars indicate one standard deviation. k, Left ALPM of a Tg(nkx2.5:Kaede) embryo photoconverted (white box) at 14ss and subsequently imaged in the red (l) and green channels (inset), (n=5). m-o′, Nkx2-5IRESCre; ROSAYFP embryos co-stained with PECAM1 (red) and DAPI (blue). Arrows indicate YFP+/PECAM+ lineage traced endothelial cells. o′, Left PAA 6 junction with DA. p, Graph depicting the average percentage of endothelial cells (PECAM1+) co-expressing YFP within each PAA. Cells counted across two embryos: E9.5 (PAA 1, n=244), E10.5 (PAA 2, n=216, PAA 3, n=1357, PAA3 + aortic sac, n=642), and E11.5 (PAAs 4, n=511 and 6, n=649). a,e,g,k, dorsal views, anterior up; b-d,f,h,i,l, lateral views, anterior left. Scale bar = 50μm. Abbr: hpf, hours post-fertilization; dpf, days post-fertilization; H, heart; AS, aortic sac; DA, dorsal aorta; PAA number and left (L) and right (R) designations indicated.

