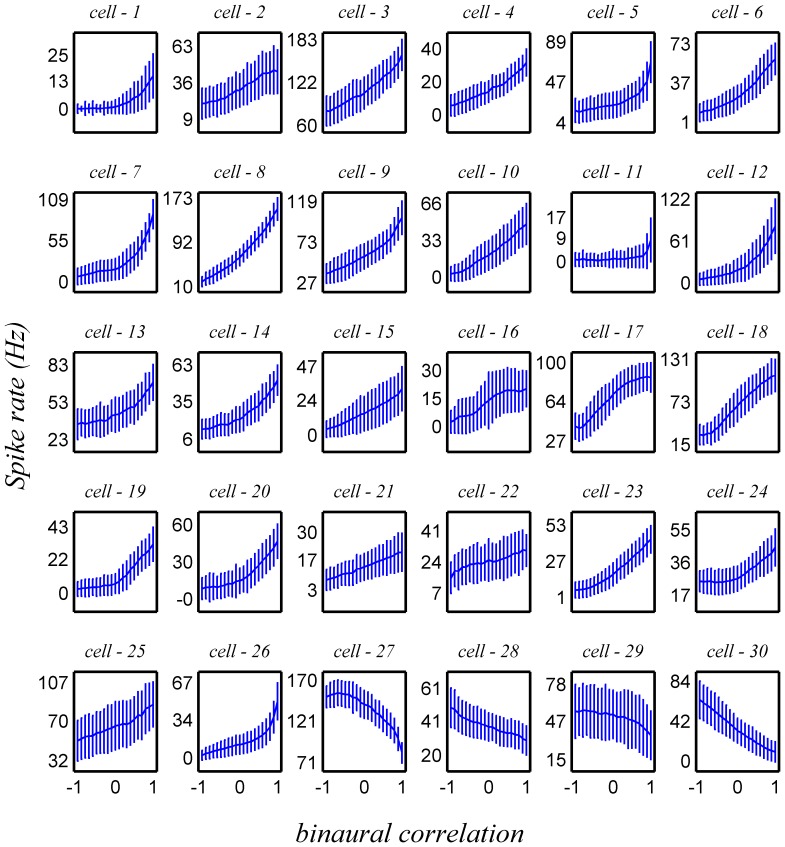
Figure 1. Neuronal heterogeneity.
The conditional mean (over 200–500 trials for given stimulus BC) firing rate is plotted as a function of the binaural correlation level for the 30 different cells in the data set. The error bars depict the standard deviation of the firing rate. The firing rates were computed for the period of 100 ms following stimulus onset. Typically, the tuning curves are monotonic in the BC and approximately linear.

