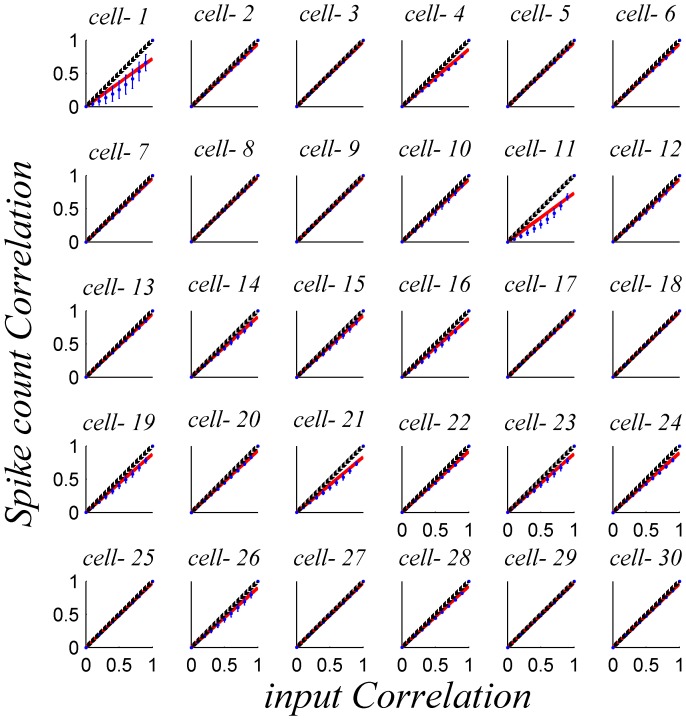
Figure 4. Mean spike-count correlation coefficient  as function of input correlation
  for homogeneous pseudo-populations.
Pseudo-population responses of  neurons were generated based on the response distribution of each of the 30 neurons in our data set, shown by the different panels. To compute the spike count correlations we simulated the response of the pseudo population for 1000 trials for every stimulus condition. The correlation coefficient matrix was averaged across all 21 different BC levels in our data set. The red line shows a linear fit that is forced through zero, for comparison, and the black line is the identity line.

