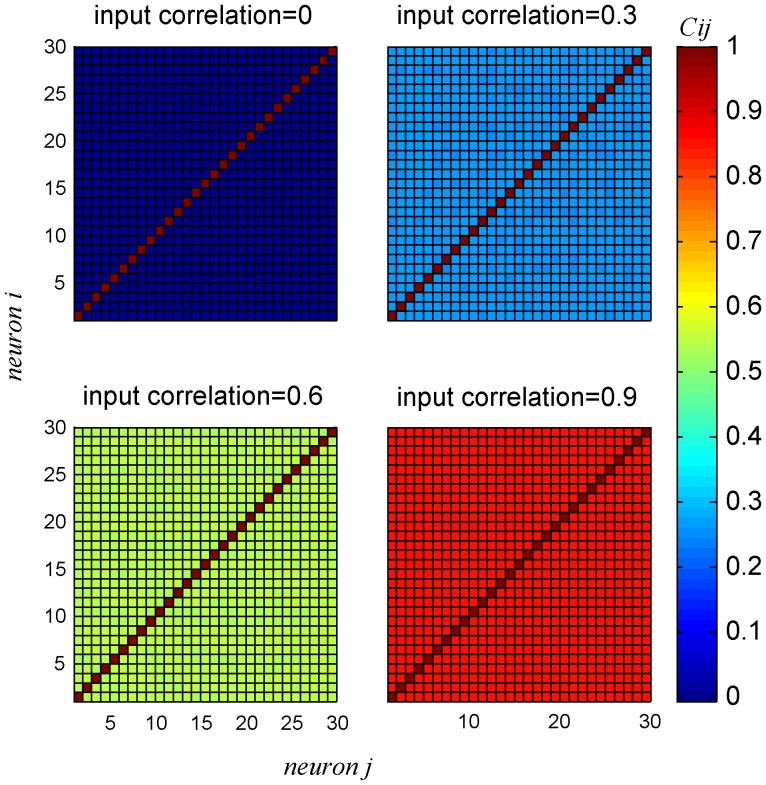
Figure 5. Spike count correlation coefficient  matrices for different levels of input correlation
  in a homogenous pseudo-population, using the response distribution of cell 9.
The correlation coefficients were averaged over all stimulus conditions,  . For each stimulus condition the correlation coefficient matrix was estimated by generating 10,000 trials for the pseudo population response for the given stimulus.

