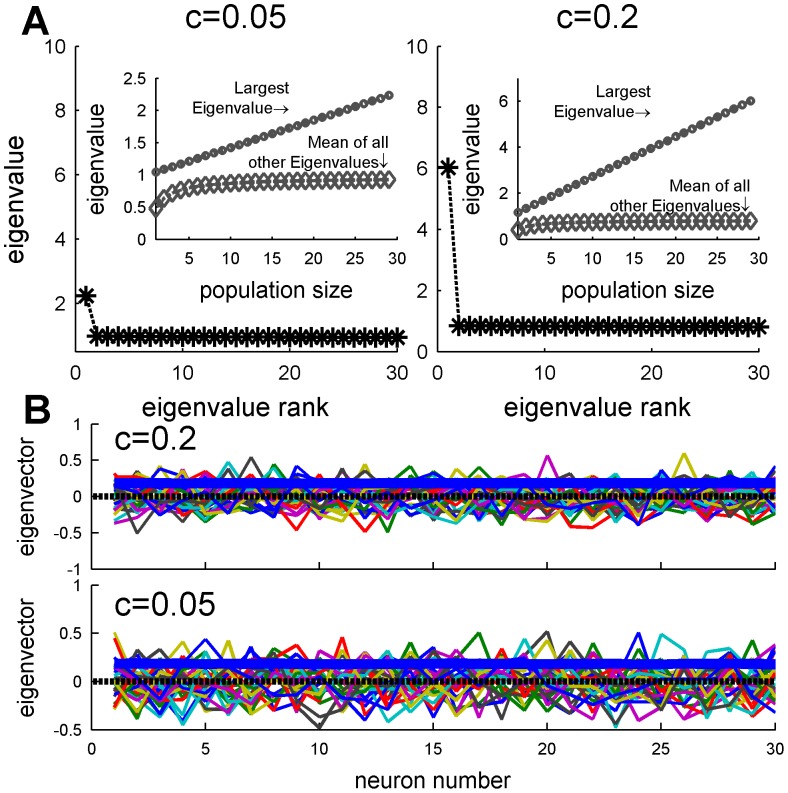
Figure 6. Eigenvalue spectrum and eigenvectors of the spike count correlation coefficient  matrix.
(A) The spectrum of the correlation matrix of a homogenous pseudo-population of 30 neurons, with input correlations of  , and
, and  is shown,. The inset shows the largest eigenvalue (circle) and mean of all other eigenvalue (diamond) as function of population size. (B) The eigenvectors of the correlation matrices A are shown by the different colors. The thick blue lines show the eigenvector that corresponds to the largest eigenvalue.

