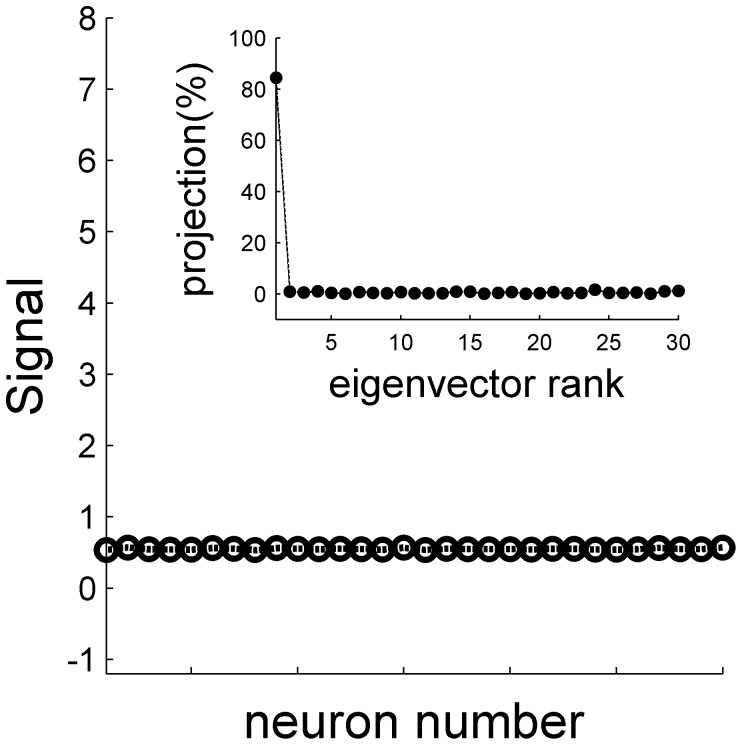
Figure 7. The signal in a homogeneous population.
The signal, in terms of the covariance between the neural response and the stimulus is shown as a function of the neuron number in a homogeneous population based on the responses of cell 13. As the population is homogeneous the signal is distributed homogeneously in the responses of the different neurons in the population. The inset shows the distribution of the signal over the different eigenvectors of the neural spike-count correlation matrix (with uniform correlation coefficient of 0.2), as a function of the rank of their eigenvalue. The inset shows the projection of the signal vector on each eigenvalue in percent. Note that the first eigenvector corresponds to the uniform vector (cf Figure 7). The signal and the correlation matrix were estimated using 10,000 repetitions for every stimulus value  .
.

