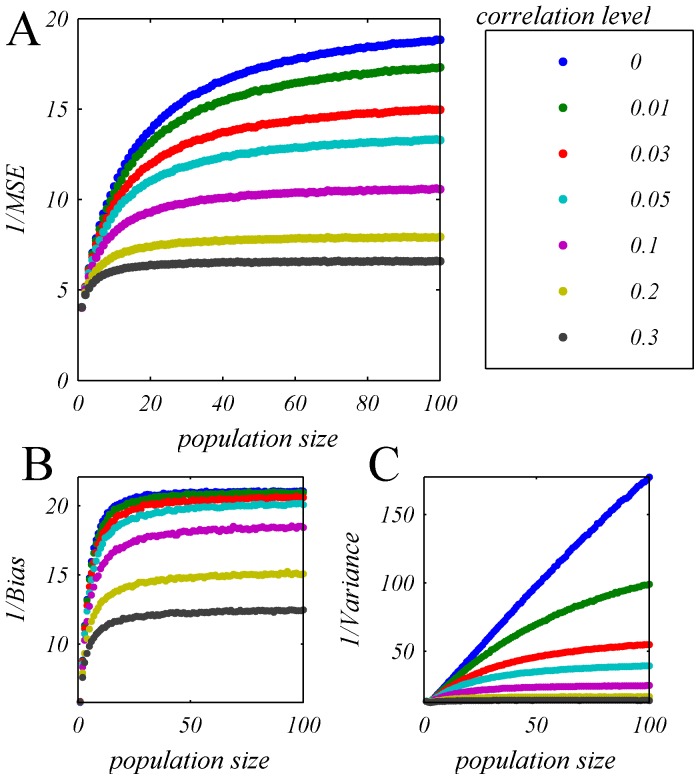
Figure 8. OLE accuracy in a homogeneous pseudo population.
The OLE accuracy is shown in terms of: A one over the mean square estimation error, and its components: B the inverse of the bias and C the inverse of the variance, as a function of the number of cells for different levels of uniform correlations, by the different colors. The dots show the estimated OLE accuracy that was measured by first training the OLE weights using 10500 trials of psedo-population response (i.e., 500 trials per stimulus condition) and estimating the accuracy over 10500 trials of generalization, this procedure was repeated and averaged 100 times. Note that as the pseudo-populations are homogeneous and are uniquely determined by the marginal response distribution of a single neuron, there is no need to average over different realizations of the population. Specifically, here we have used the response distribution of cell 13 (Figure 1) to define the population response.

