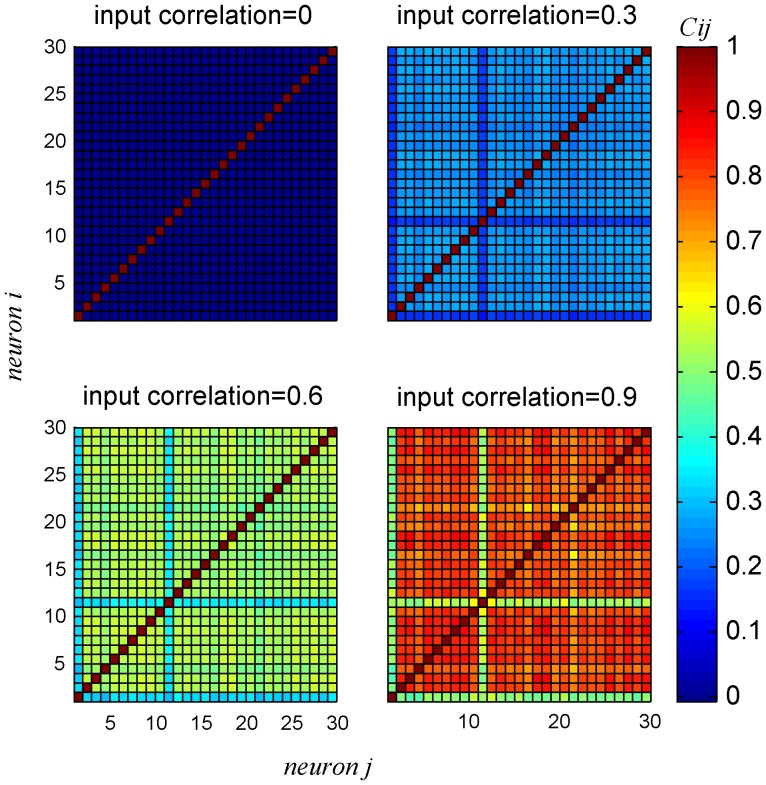
Figure 9. Spike count correlation coefficient  matrices for a specific realization of a heterogeneous population of neurons for different levels of input correlation,
  from bottom to top.
The correlation coefficients matrix was computed for heterogeneous pseudo-population of  neurons composed of all 30 neurons in the data set. The correlation coefficient matrix was computed by averaging over all stimulus conditions. For each stimulus (BC level), the conditional correlation coefficient matrix was estimated by generating 10,000 realizations of the pseudo population response.

