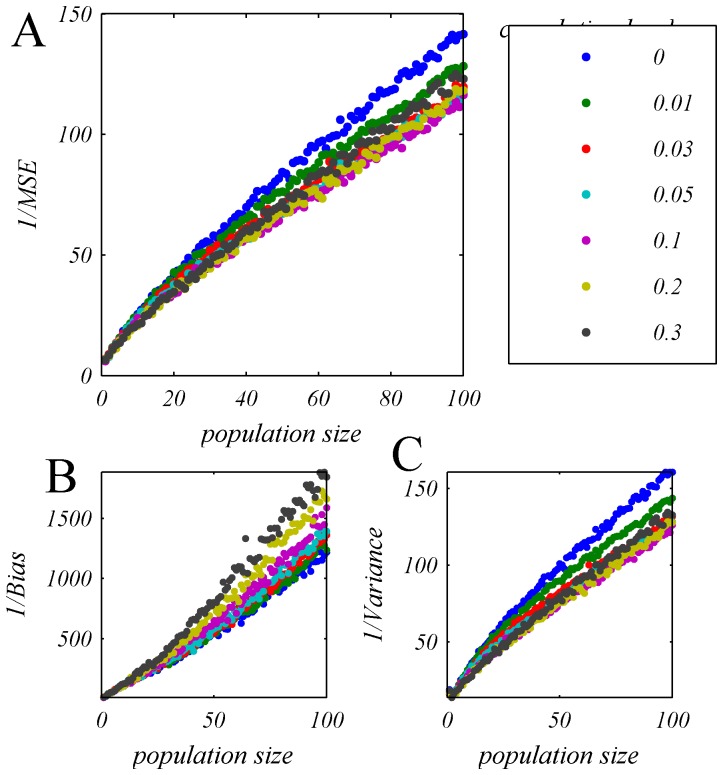
Figure 13. One over the Mean Square Error (A), bias (B) and variance (C) of OLE estimation, plotted as function of population size for heterogeneous pseudo-population with different input correlation level (different color).
All heterogeneous pseudo-populations created based on empirical response statistics of 30 cells. The OLE weights were learned from a training set of 500 trials per stimulus condition and the accuracy of the readout was estimated using a generalization set of the same size. For each value of population size the accuracy was averaged over 100 realizations of the neural population, where the different cells in each realization were drawn independently with equal probabilities (with repetitions) from the pool of all neurons.

