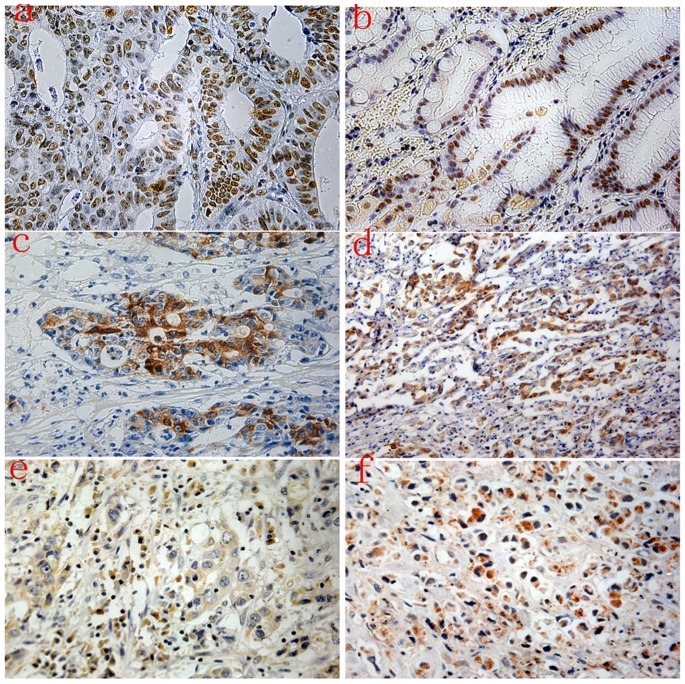
Figure 1. Immunohistochemical expression levels of NPM, TFF3 and TACC1 in gastric cancer.
Strong staining of NPM was observed in the nucleolus, nucleus and cytoplasm of tumor epithelial cells (a, b). High expression of TFF3 (c and d) was predominantly observed in the cytoplasm of tumor epithelial cells. TACC1 was expressed in the cytoplasm of tumor epithelial cells (e and f).

