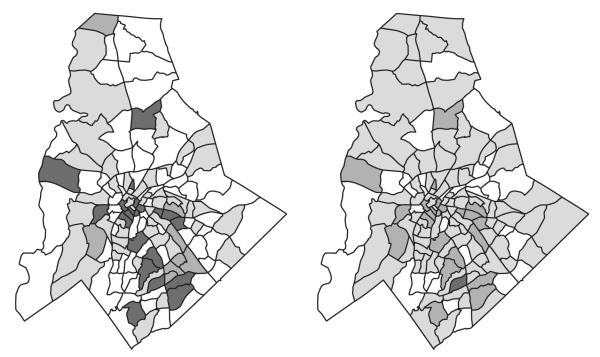
Fig. 2.
Baseline tract-specific rates of (a) preterm births (less than 37 gestational weeks) (◻, [6.8, 7.25)%;  , [7.25, 7.45)%;
  , [7.45, 7.55)%;
  , [7.55, 8]%) and very preterm birth (less than 34 gestational weeks) (◻, [1.45, 1.55)%;
  , [1.55, 1.65)%;
  , [1.65, 1.75)%;
  , [1.75, 1.85]%): baseline hazard rates are calculated at the average value of each covariate across all areas; estimates are from a model that includes space–time interaction baseline hazards and average PM2.5-levels over the entire pregnancy

