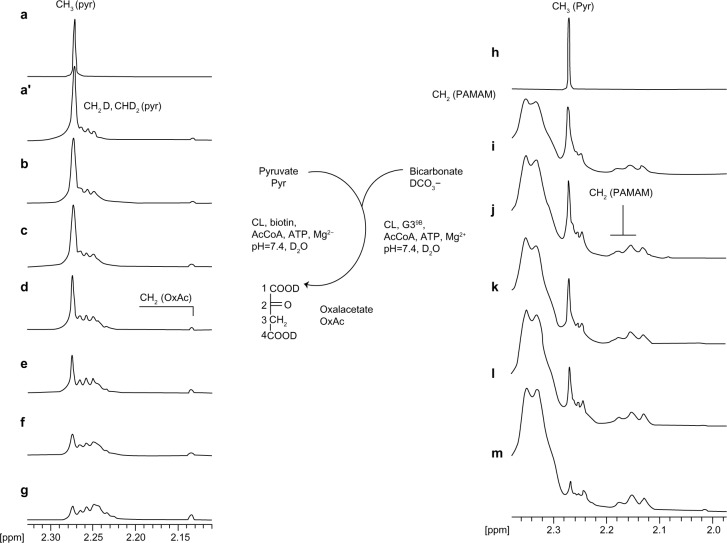
Figure 3.
The relevant regions of 1H nuclear magnetic resonance spectra of Pyr (trace a) and reaction mixtures composed of (left stack) pyruvate (Pyr, 40 mM) bicarbonate (HCO3−, 40 mM), adenosine-5′-triphosphate (ATP; 25 mM), Mg2+ (both 40 mM), acetylcoenzyme A (AcCoA, 0.25 mM), biotin (2.5 mM), and pyruvate carboxylase (CL, 0.2 units); traces b–g (b, starting spectrum; c–g, after 5 minutes [c], 15 minutes [d], 40 minutes [e], 90 minutes [f], and 120 minutes [g] of reaction); (right stack) the concentration of Pyr, HCO −, ATP, Mg2+3, and AcCoA as specified (series b-g), the 0.25 mM G39B, and 0.2 units of CL; traces i–m (i, starting spectrum; j–m, after 5 minutes [j], 10 minutes [k], 40 minutes [i], and 90 min [m] of reaction).

