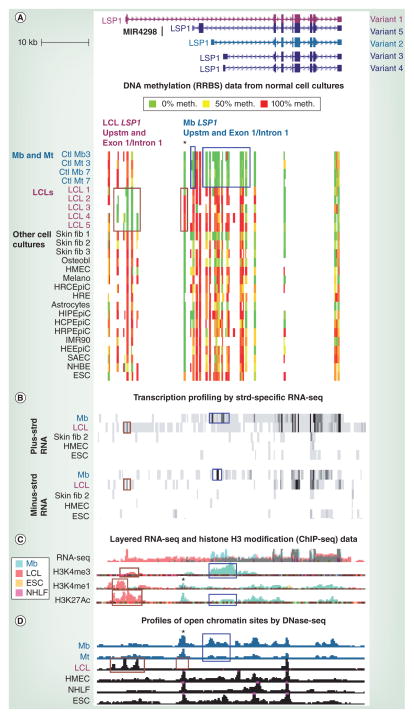
Figure 2. Opposite distributions of DNA methylation and open chromatin in myoblast and lymphoblastoid cell line samples were correlated with LSP1 alternative promoter usage (facing page).
(A) RRBS data tracks (ENCODE/DNA methylation by reduced representation bisulfite sequencing; HudsonAlpha Institute for Biotechnology, AL, USA) for the region in Figure 1 are illustrated. Each culture is from a different individual except for Mb and Mt samples with the same number. The average methylation level of each detected CpG is shown according to the indicated color scheme; intermediate values are indicated by intermediate colors. At this scale, almost all the signal seen in the figure is from clusters of CpGs rather than individual CpGs. Blue boxes show myogenic DNA hypomethylation at the Mb-specific variant 2 upstm region, exon 1 and part of intron 1. Wide or narrow brown boxes show LCL-specific hypomethylation or hypermethylation, respectively. (B) Strd-specific RNA-seq profiles (ENCODE/long RNA-seq, polyA+, Cold Spring Harbor [NY, USA]) are shown for the indicated cell types (vertical viewing range 1–100 for the plus strd and 1–10 for the minus strd). Blue and brown boxes denote Mb- and LCL-specific signal, respectively, for exon 1 sense RNA or nearby antisense RNA signal. The multiple exons in the blue boxed region for Mb are from the first exons of variant 2 and other, less prevalent, Mb-specific RNAs that are similar, but not identical to, variants 3 and 4 (Cufflinks analysis [69]). (C) RNA-seq (not strd-specific; ENCODE/ CalTech [CA, USA]) and modified-H3 ChIP-seq (ENCODE/histone modification, Broad Institute [MA, USA]) are shown with results for four cell types superimposed, as indicated by the color key. Blue boxes denote Mb-specific H3 modifications characteristic of active promoters and brown boxes show LCL-specific H3 modifications typical of active promoters or enhancers. (D) DNaseI hypersensitivity mapping (ENCODE/DNase sequencing, Duke University [NC, USA]) using Mb and Mt samples that overlapped those of (A). Combined results from two to three biological replicates are shown. Boxes show the Mb-, Mt- or LCL-specific DNase sequencing peaks in promoter or enhancer regions. The only LCL shown is LCL1, but the other four LCL samples gave similar results. Asterisks mark the subregion with LCL-associated hypermethylation and a DNase-seq peak seen in all cell types other than in LCLs. ChIP-seq: Chromatin immunoprecipitation coupled with next-generation DNA sequencing; Ctl: Control; ESC: Embryonic stem cell; HCPEpiC: Choroid plexus epithelial cell; HEEpiC: Esophageal epithelial cell; HIPEpiC: Iris pigment epithelial cell; HMEC: Human mammary epithelial cell; HRCEpiC: Retinal pigment epithelial cell; HRE: Renal epithelial cell; HRPEpiC: Retinal pigment epithelial cell; IMR90: Fetal lung fibroblast; LCL: Lymphoblastoid cell line; Melano: Melanocyte; Mb: Myoblast; Mt: Myotube; NHBE: Bronchial epithelial cell; NHLF: Normal human lung fibroblast; Osteobl: Osteoblast; RNA-seq: RNA sequencing; RRBS: Reduced representation bisulfite sequencing; SAEC: Small airway epithelial cell; Skin fib 1: Fibroblast cell strain from a child; Skin fib 2: A neonatal foreskin fibroblast cell strain; Skin fib 3: A different neonatal foreskin fibroblast cell strain; Strd: Strand; Upstm: Upstream.
Data taken from [101].

