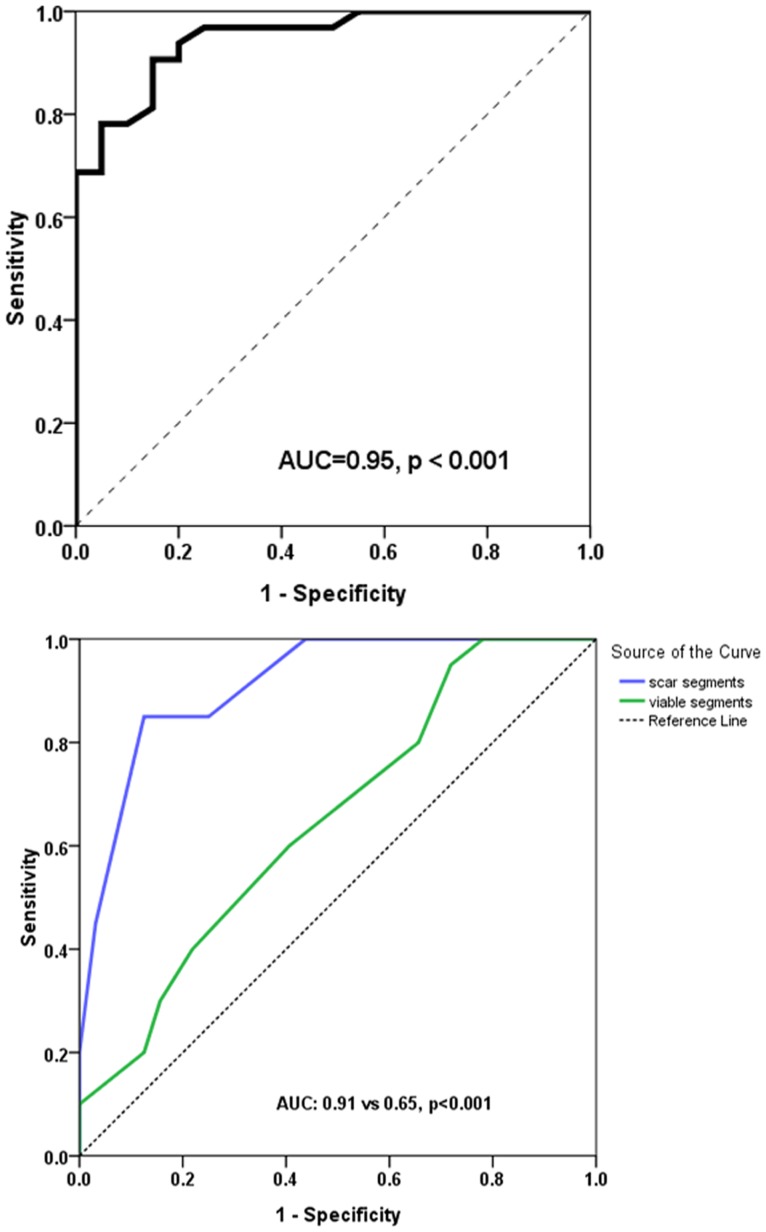
Figure 3. ROC Analysis of Dysfunctional Segments and Comparison of ROC Curves Between Scar and Viable Segments.
ROC analysis demonstrated ≥35.5% of dysfunctional segments with wall motion improvement predicts global functional recovery (top). Comparison of ROC curves showed that the number of scar segments (AUC = 0.91) predict global functional improvement superior to the number of viable segments (AUC = 0.65) (p<0.001) (bottom). AUC, area under the curve of the receiver-operating-characteristic. ROC, receiver-operator-characteristic.

