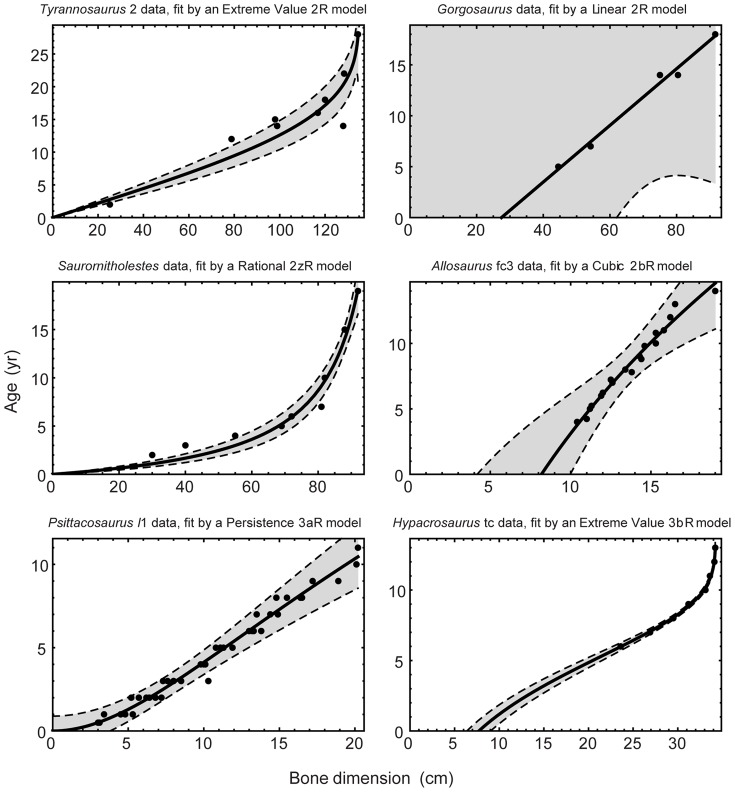
Figure 5. Best-fit growth curves for selected dinosaur taxa.
Curves are the results of non-linear regressions in which bone dimension was used as the independent variable and age as the dependent variable. In each case, the curve shown provided the best fit to the data ( ) among 77 alternative models. See Table S8 for fit parameters and Fig. S12 for plots of best-fit curves for other taxa. The shaded area is the 95% confidence band, assuming homoscedastic, normally distributed errors.

