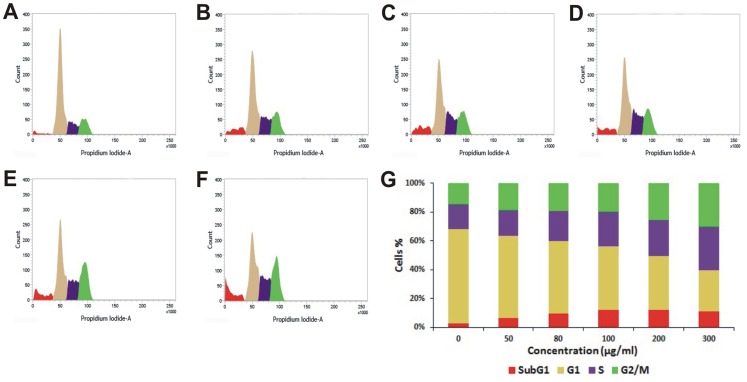
Figure 5. Flow cytometric cell cycle distribution of PRME treated MCF-7 cells with increasing doses.
Sub-G1, G1, S, and G2/M phases of MCF-7 cells treated for 48 hours with different concentrations: (A) Control, (B) 50 µg/ml, (C) 80 µg/ml, (D) 100 µg/ml, (E) 200 µg/ml, (F) 300 µg/ml of PRME. (G) Graphical representation of % cell population in different phases.

