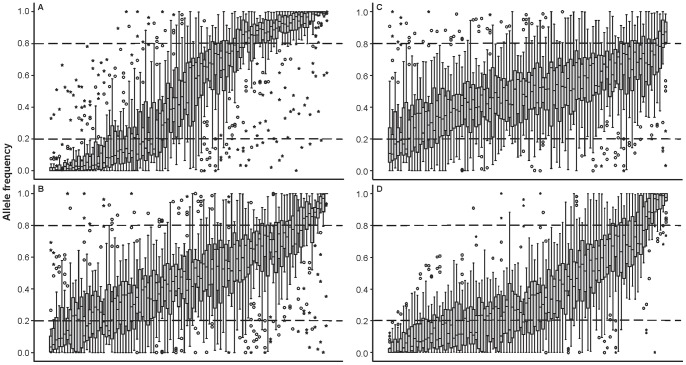
Figure 5. Distribution of allele frequencies for the 100 top-ranked SNPs.
Allele frequencies of the 100 top-ranked SNPs in 23 populations identified using four selection approaches: (A) global F ST; (B) pairwise F ST; (C) Delta, and (D) outlier. Horizontal line, grey rectangle, whiskers, open circles, and stars indicate median, 25th and 75th quartiles, non-outlier range, outliers and extreme outliers, respectively.

