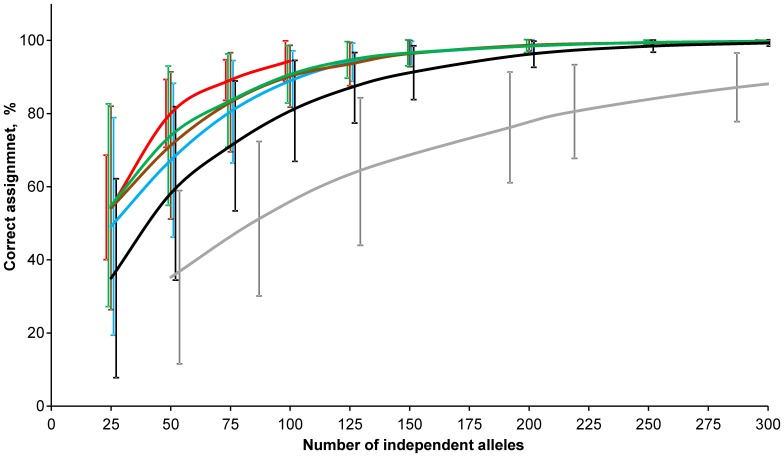
Figure 7. Overall assignment success for SNPs and STRs in dataset I.
SNPs were ranked using i) global F ST (blue), ii) pairwise F ST (brown), iii) Delta (green) and iv) outlier approach (red). Overall assignment success of STRs and randomly chosen SNPs are shown as gray and black lines, respectively. The bars are representing standard deviation of assignment success among all populations for each ranking approach. The standard deviation bars were arranged for visual purposes to avoid overlapping.

