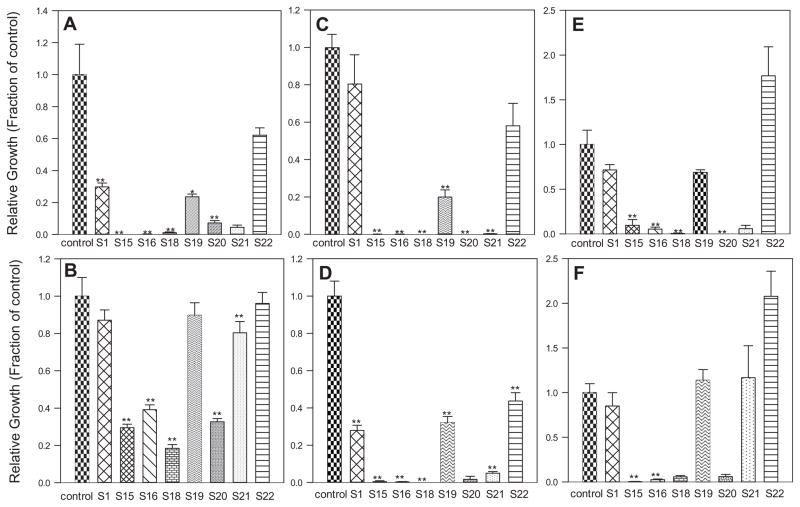
Fig. 3.
Protocol 1 (see Table 1.A.): (A). P. aeruginosa on the surface. (B). P. aeruginosa in the medium. (C). S. aureus on the surface. (D). S. aureus in the medium. (E). S. epidermidis on the surface. (F). S. epidermidis in the medium. The average of each experimental value was divided by the average control value and plotted. *p < .05, **p < .01 compared to control values.

