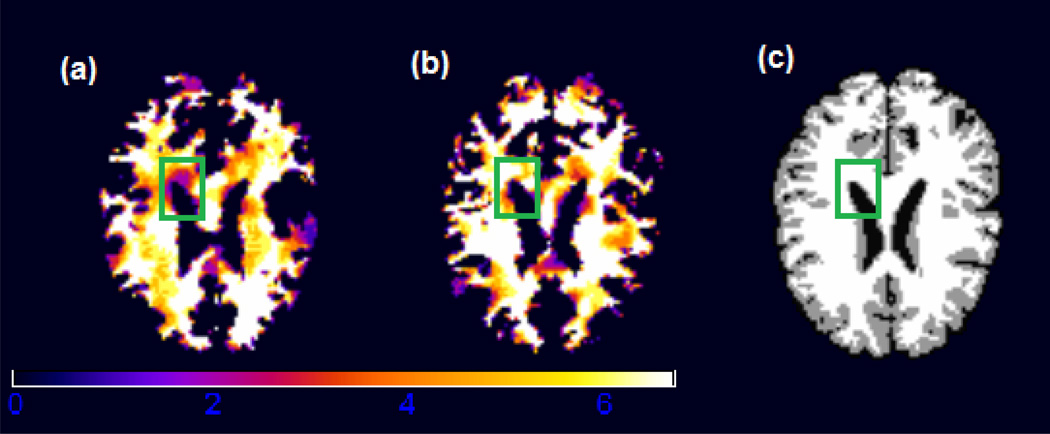
Figure 4.
White matter RAVENS map for two randomly selected children from the ADHD study. The image from subject b shows a higher brightness inside the green square, reflecting the fact that for the brain of subject b, relatively more white matter was forced to fit the same template (panel (c)) at that particular region.

