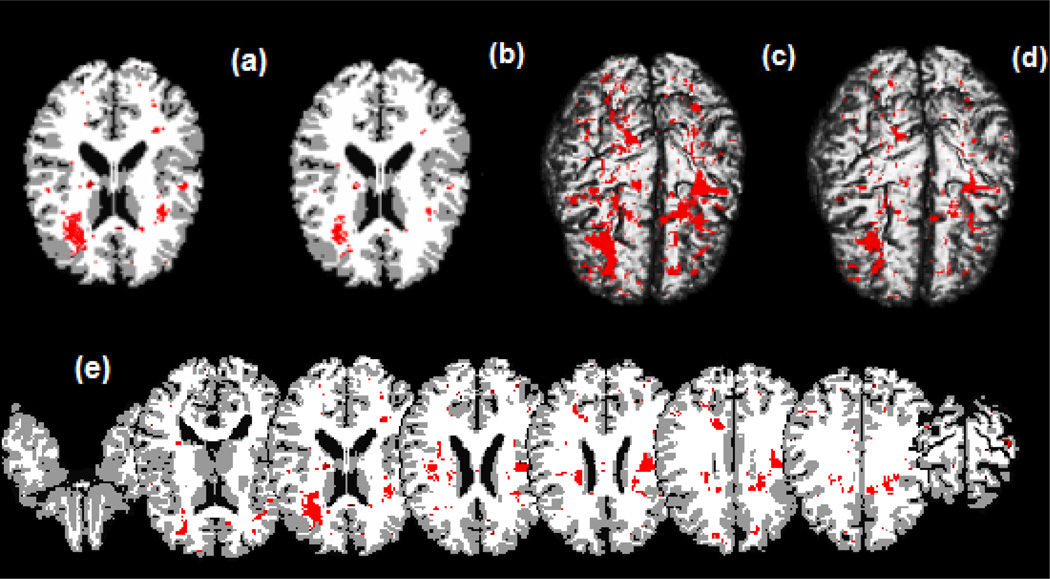
Figure 7.
ADHD data analysis results. Top panels: significant regions in the brain where there exists a morphological difference between children with ADHD and children who do not have the disorder, based on a 95% credible interval. Panel (a) is a selected axial slice of the STM estimate overlaid on the Jacob template; (b) is the same selected slice showing the estimates of the spatial model with the transformation parameters Λ fixed and equal to 1 for all voxels also overlaid on the template; (c) and (d) are, respectively, the results of a 3D rendering of the STM and of the no transformation model both overlaid on the Jacob template. Bottom panel: (e) shows selected axial slices of the STM estimates overlaid on the template. Red areas show the significant regions in the brain where there exists a morphological difference between children with ADHD and children who do not have the disorder.

