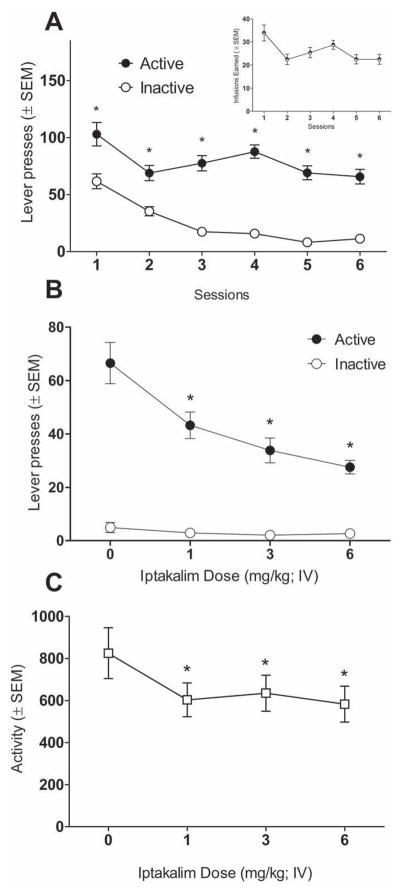
Figure 2.
Panel A shows mean (±SEM) lever presses during nicotine self-administration phase (*significantly different from inactive lever; inset graph shows total infusions earned during the session). Panel B shows mean (±SEM) lever presses during iptakalim dose-response tests (*significantly different from 0 mg/kg active lever responding). Panel C shows mean (±SEM) chamber crosses during the iptakalim dose-response tests (*significantly different from 0 mg/kg; p<0.05).

