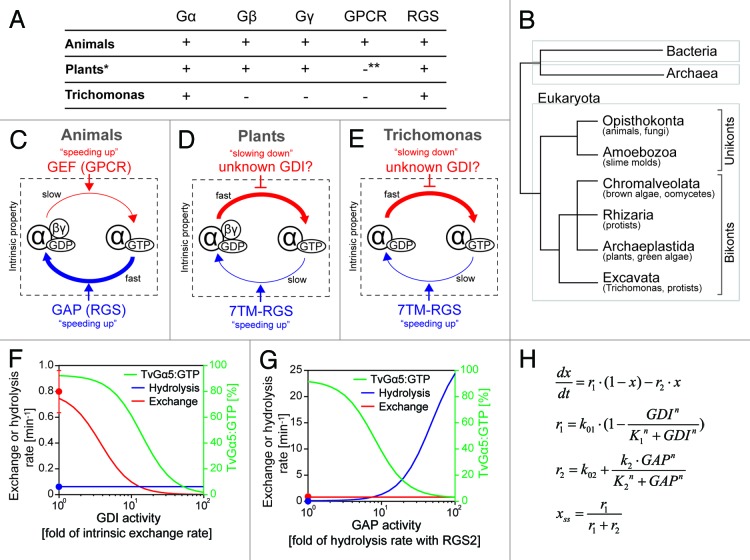
Figure 1. G-protein components and intrinsic properties seen in animals, plants, and Trichomonas. (A) G-protein-related genes encoded in the animal, plant, and Trichomonas genomes. *Some plants (e.g., cereals) lack RGS genes. **Plants have one 7TM protein that has weak similarity to the slime mold cAMP receptor, but the original function of this protein is not a GPCR. (B) Classification of eukaryotes by molecular phylogenetics. Eukaryotes are classified into 2 basal clades, unikonta and bikonta, subclassified into 6 monophyletic supergroups, Opisthokonta, Amoebozoa, Chromalveolata, Rhizaria, Archaeplastida and Excavata. Unikonta includes animals, fungi, and slime molds, while bikonta includes plants, algae, and protists. Note: G-protein genes (Gα, Gβ, and Gγ) are only found in eukaryotes. (C–E) G-protein machinery in animals, plants, and Trichomonas. (C) Animal G-protein slowly exchanges GDP for GTP and rapidly hydrolyzes GTP. GPCRs and other GEFs increase the rate of nucleotide exchange, therefore shifts the Gα state onto active “GTP-bound” form. RGSs and other GAPs speed up the hydrolysis reaction. (D) Plant G protein rapidly exchanges nucleotide and slowly hydrolyses GTP. 7TM-RGSs promote GTP hydrolysis by Gα and keep the inactive GDP-bound state. Regulators controlling the exchange rate are not found in plants, except the Gβγ dimer, which has a weak GDI activity. (E) Trichomonas G-proteins rapidly exchange nucleotide and slowly hydrolyze GTP. 7TM-RGSs enhance the GAP activity of Gα, but the hydrolysis rate with RGS is not enough to keep the GDP-bound state of Gα. Note: Trichomonas lacks Gβγ dimer. (F–H) Simple qualitative model was developed to simulate the steady-state fraction of GTP-bound TvGα5 (% of TvGα5:GTP) in response to the variation of GDI or GAP activities. (F) The model shows that as GDI activity increased, the exchange rate and the % of TvGα5:GTP decreased, while the hydrolysis rate did not vary. The red or blue line (with y-axis on the left) shows rates for nucleotide exchange or GTP hydrolysis over increased activity of GDI. The red or blue dots indicate intrinsic exchange rate of TvGα5 or the hydrolysis rate promoted by TvRGS2, as reported [Bradford W, 2013]. The green line (with y-axis label on the right) shows the percentage of the % of TvGα5:GTP. (G) The model shows an enhanced hydrolysis rate as GAP activity increased, resulting in a significant decrease in the % of TvGα5:GTP. The nucleotide exchange rate did not vary. (H) Mathematical equations used in the model. x = % of TvGα5:GTP in the total pool of TvGα5, which is assumed here to remain at a constant level. The steady-state of x is denoted as xss. r1 or r2 is the rate of nucleotide exchange or hydrolysis, respectively. Their computed values are shown in panels (F and G) (with y-axis on the right) with respect to changes in GDI and GAP activity. Rate constant k01 or k02 is the rate of intrinsic nucleotide exchange or steady-state hydrolysis rate with the cognate GAP, TvRGS2; k01 = 0.8 min−1, k02 = 0.062 min−1. K1 and K2 represents the functional threshold of GDI and GAP activity, K1 = K2 = 3 min−1. k2 denotes the maximum enhance in the hydrolysis as the GAP activity increases, k2 = 30 min−1. n is the Hill coefficient, n = 2.

An official website of the United States government
Here's how you know
Official websites use .gov
A
.gov website belongs to an official
government organization in the United States.
Secure .gov websites use HTTPS
A lock (
) or https:// means you've safely
connected to the .gov website. Share sensitive
information only on official, secure websites.
