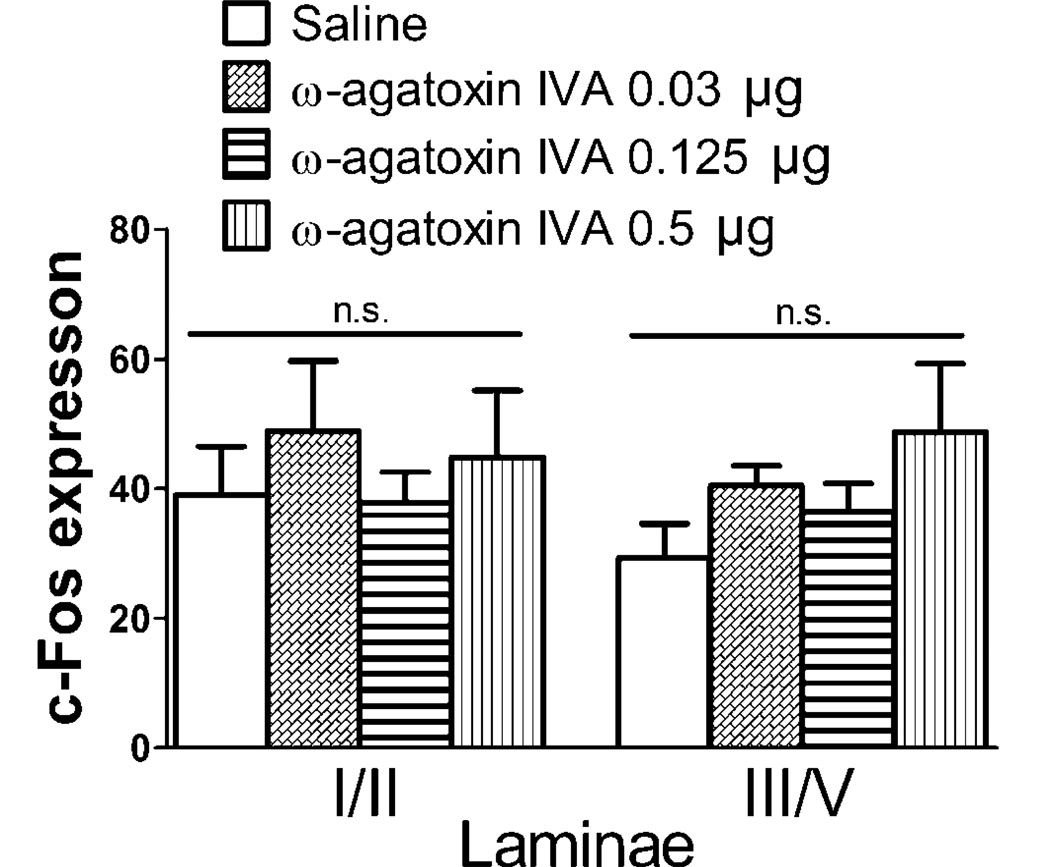
Figure 5.
Effects of intrathecal (IT) ω-agatoxin IVA on formalin-induced c-Fos expression. Histogram represents the number of c-Fos positive neurons in lamina I/II and lamina III/V of ipsilateral dorsal horn. Data from L3-L6 spinal segments were pooled. There was no significant difference between treatment groups. Data are expressed as Mean ± SEM. N = 2–5 rats per group.

