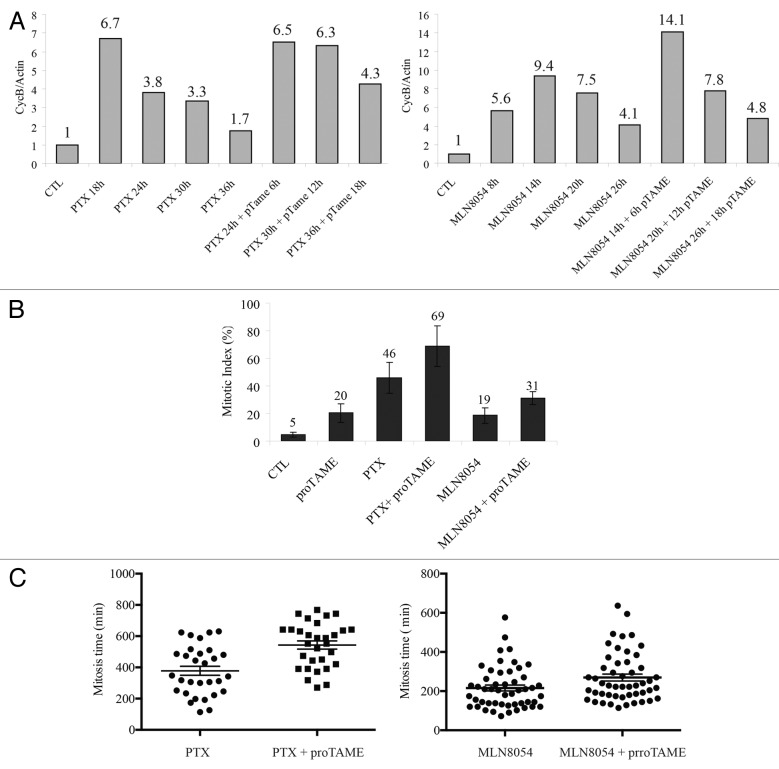
Figure 3. proTAME delays mitotic exit of cells treated with anti-mitotic drugs. (A) Cyclin B stability evaluated in HEp2 cells treated with PTX (left panel) or MLN8054 (right panel) with or without the addition during the last 6, 12, or 18 h of treatment of the APC inhibitor proTAME at 12 µM by western blot analysis (see Fig. S3 for proTAME treatment dynamics). Graphs represent cyclin B values normalized over Actin and the control sample. (B) Mitotic index was evaluated by DNA staining to study the effects of 12 µM proTAME alone for 6 h, 10 nM PTX alone for 24 h, 4 µM MLN8054 for 14 h and 24 h PTX or 14 h MLN8054, where proTAME was added for the last 6 h of treatment. Figure represents the average counts of 5 fields. (C) Left: scatter plots representing mitotic timing monitored by time-lapse microscopy of GFP-H2B HEp2 cells pre-treated with PTX for 12 h in presence or absence of proTAME (P value < 0.001, ± SEM). Right: scatter plots representing mitotic timing of GFP-H2B HEp2 cells pre-treated with MLN8054 for 8 h in presence or absence of proTAME (P value < 0.05, ± SEM).

An official website of the United States government
Here's how you know
Official websites use .gov
A
.gov website belongs to an official
government organization in the United States.
Secure .gov websites use HTTPS
A lock (
) or https:// means you've safely
connected to the .gov website. Share sensitive
information only on official, secure websites.
