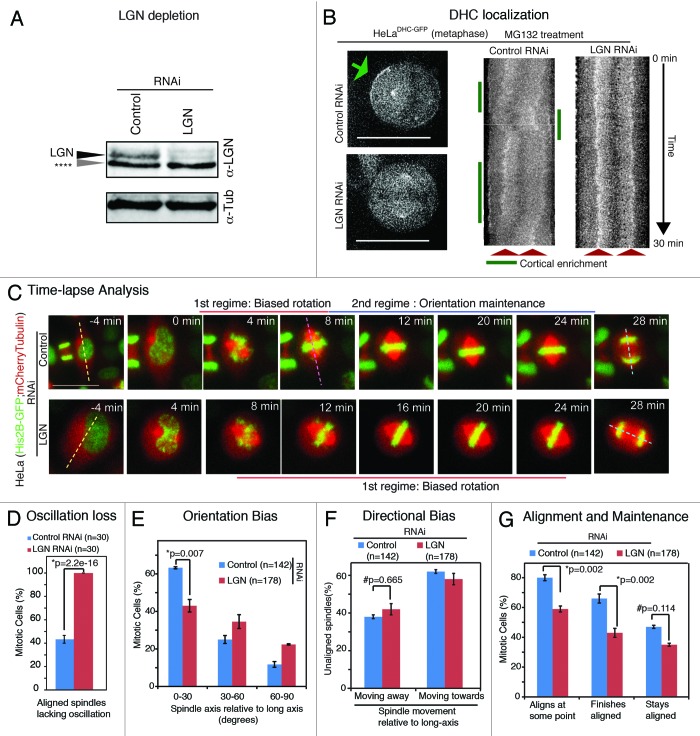
Figure 3. LGN controls spindle rotation speed but not directional bias in rotation (A) Immunoblot of cell lysates treated with LGN RNAi or control RNAi as indicated were probed with antibodies against LGN and tubulin. Grey arrow (****) refers to nonspecific band. (B) Single-plane live cell images (left) and their kymographs (right) of HeLaDHC-GFP cells treated with LGN or control siRNA as indicated. DHC-GFP at cell cortex marked with green arrow. Scale bar = 20 μm refers to indicated panel alone. Other images are cropped 40% to highlight the spindle. Kymographs showing DHC-GFP levels at spindle poles and cell cortex along pole-to-pole axis are generated from flattened time-lapse Z stacks, acquired once every minute, of cells treated with LGN or control siRNA. Spindle pole location (red arrows) and DHC-GFP enrichment at cell cortex (green lines) are marked. (C) Time-lapse images of control or LGN siRNA-transfected HeLaHis2B-GFP; mCherry-Tub cells undergoing cell division. Dashed lines indicate interphase long-axis (yellow), first alignment along long-axis (pink) and final spindle orientation axis (blue). Scale bar = 20 μm. (D) Graph of percentage of mitotic cells with no spindle oscillation in cells treated with control or LGN siRNA as assessed from time-lapse movies of HeLaHis2B-GFP; mCherry-Tub cells. (E) Frequency distribution of final orientation angles (spindle-axis relative to long-axis) in cells treated with control or LGN siRNA (n = 3 experiments). (F) Bar graph showing percentage of spindle movements toward or away from the long-axis, when spindle-axis was at least 30 degrees away from long-axis, in cells treated with siRNA as indicated. (G) Bar graph showing percentages of spindles that aligned within 30 degrees of long-axis at some point, at anaphase and maintained alignment after first alignment in cells treated with control or LGN siRNA. Error bars represent SEM from 3 independent experiments. P values are obtained using proportion test. Symbols # and * refer to insignificant and significant differences, respectively.

An official website of the United States government
Here's how you know
Official websites use .gov
A
.gov website belongs to an official
government organization in the United States.
Secure .gov websites use HTTPS
A lock (
) or https:// means you've safely
connected to the .gov website. Share sensitive
information only on official, secure websites.
