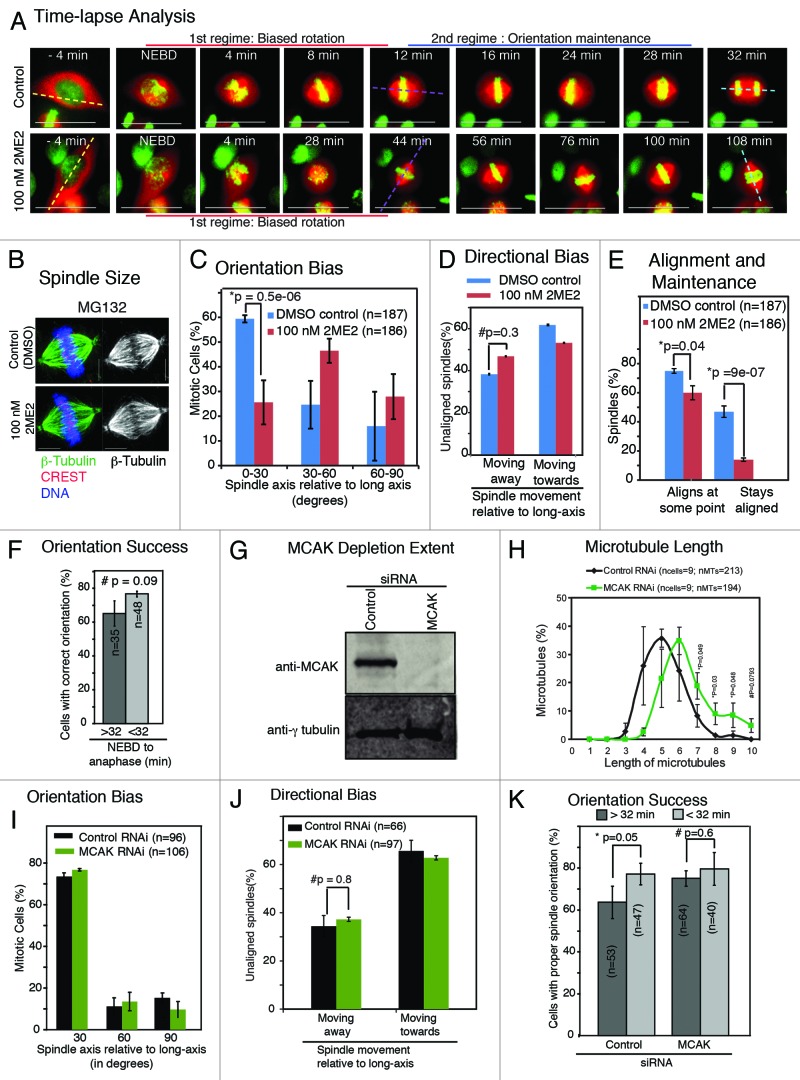
Figure 4. Orientation maintenance is exquisitely sensitive to suppression of microtubule dynamics. (A) Time-lapse images showing spindle and chromosome movements in HeLaHis2B-GFP; mCherry-Tub cells treated with or without 100 nM 2ME2. Long-axis, first spindle alignment axis, and final spindle orientation axis are marked in yellow, purple, and blue dashed lines, respectively. Scale bar = 30 μm. (B) Immunofluorescence images showing spindle size and architecture in 100 nM 2ME2- or DMSO- (control-) treated HeLa cells arrested in metaphase using MG132 and immunostained with antibodies against β-tubulin and CREST (kinetochore marker) and stained with DAPI for DNA. Scale bar = 5 μm. (C) Frequency distribution of final orientation angles (spindle-axis relative to long-axis) in cells treated with 100 nM 2ME2. (D) Graph showing percentage of spindle movements either toward or away from the long-axis in unaligned spindles oriented at least 30 degrees away from long-axis, in cells treated with DMSO or 2ME2. (E) Graph showing percentage of mitotic cells that aligned spindles at some point and maintained alignment, within 30 degrees of the long-axis, in cells treated with DMSO or 2ME2. (F) Graph showing percentage of mitotic cells that oriented spindles within 30 degrees of the long-axis in unperturbed HeLaHis2B-GFP; mCherry-Tub cells with an NEBD to anaphase onset time greater or lesser than 32 min. (G) Immunoblots of cell lysates treated with siRNA oligos and immunostained with antibodies as indicated to assess the extent of MCAK depletion following MCAK RNAi. (H) Graph showing distribution of microtubule lengths (μm) in monopolar spindles of cells treated with siRNA as indicated and exposed to monastrol for 3 h prior to immunostaining with antibodies against β-tubulin. (I) Graph of distribution of spindle orientation angles in MCAK depleted HeLaHis2B-GFP; mCherry-Tub cells. (J) Graph showing percentage of spindle movements either toward or away from the long-axis in unaligned spindles oriented at least 30 degrees away from long-axis, in cells treated with control or MCAK siRNA. (K) Graph of percentage of mitotic cells that oriented spindles properly, within 30 degrees of the long-axis, in HeLaHis2B-GFP; mCherry-Tub cells treated with siRNA as indicated with an NEBD to anaphase onset time greater or less than 32 min. Error bars represent SEM from 3 independent experiments. n = number of cells. P values are obtained using proportion test, except for (C) where Mann–Whitney U test, was used. Symbols # and * refer to insignificant and significant differences, respectively.

An official website of the United States government
Here's how you know
Official websites use .gov
A
.gov website belongs to an official
government organization in the United States.
Secure .gov websites use HTTPS
A lock (
) or https:// means you've safely
connected to the .gov website. Share sensitive
information only on official, secure websites.
