
Figure 1.
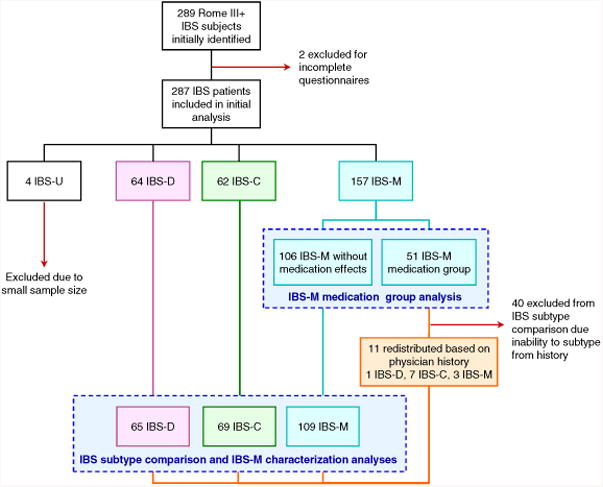
Flowchart depicting subjects selection and sample sizes for each analysis. Dashed boxes indicate groups included in each of the separate analyses: IBS-M medication group assessment and final IBS subtype characterizations.
Official websites use .gov
A
.gov website belongs to an official
government organization in the United States.
Secure .gov websites use HTTPS
A lock (
) or https:// means you've safely
connected to the .gov website. Share sensitive
information only on official, secure websites.
Flowchart depicting subjects selection and sample sizes for each analysis. Dashed boxes indicate groups included in each of the separate analyses: IBS-M medication group assessment and final IBS subtype characterizations.