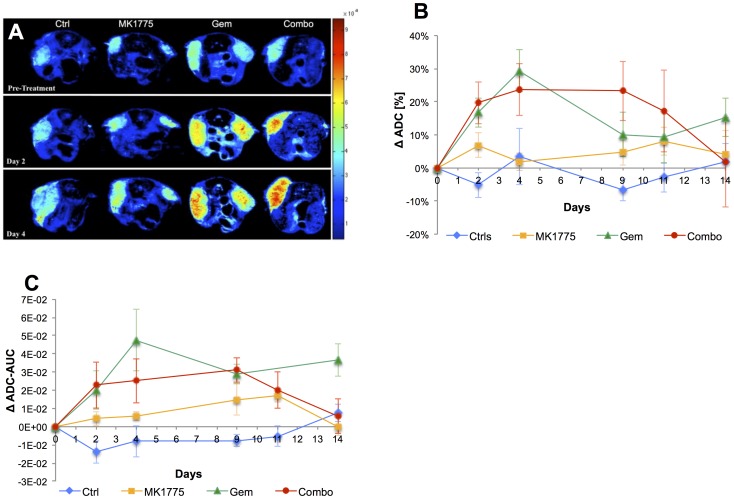
Figure 2. Assessment of diffusion properties and potential alterations between treatment groups following therapy.
(A) Parametric ADC maps demonstrating restricted tumor diffusivity for all four groups comparing pre-treatment to day 2 and 4 post-therapy. (B) Quantitative analysis of mean ADC plotted as percent change from baseline (pre-treatment) over the experimental time-line showing statistical significance between groups already by day 2 (24 hours following the first treatment on day 1). (C) To compare across mice, ADC-AUC for each mouse was quantified by subtracting pre-treatment ADC pixel fraction curves from post-therapy and plotted as the average value for each group at all time points.

