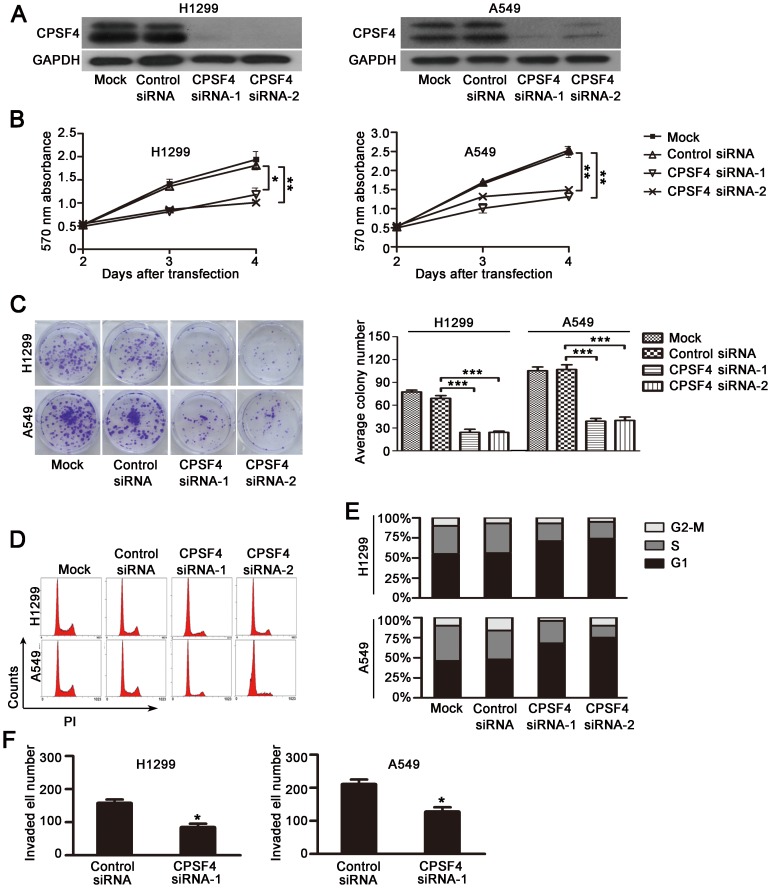
Figure 3. Knockdown of CPSF4 inhibits proliferation and survival of lung adenocarcinoma cell lines H1299 and A549.
(A) Analysis of CPSF4 expression by Western blot 3 days after siRNA transfection. Mock, vehicle control; Control siRNA, nonspecific siRNA; CPSF4 siRNA-1 and CPSF4 siRNA-2, CPSF4 specific siRNA. (B) Cell viability was measured by MTT assay. The mean and SD obtained from three independent experiments are plotted (*, P<0.05,**, P<0.01). (C) Cells were treated with CPSF4 siRNA or control siRNA (50 nmol/L) every 3 days and grown for 14 days; colonies stained with crystal violet were counted. Results are shown as the mean ± SD of three independent experiments (***, P<0.001). (D, E) At 3 days after siRNA transfection, cell cycle was analyzed by flow cytometry using PI staining. Representative data from three independent experiments are shown (D). Percentage of cells at each phase (E). (F) H1299 and A549 cells were seeded in the chamber of transwells coated with Matrigel matrix. The invasiveness of cells was determined by counted cells passing through Matrigel matrix to the basal side of transwells. *P<0.05 when compared with the nonspecific control siRNA group.

