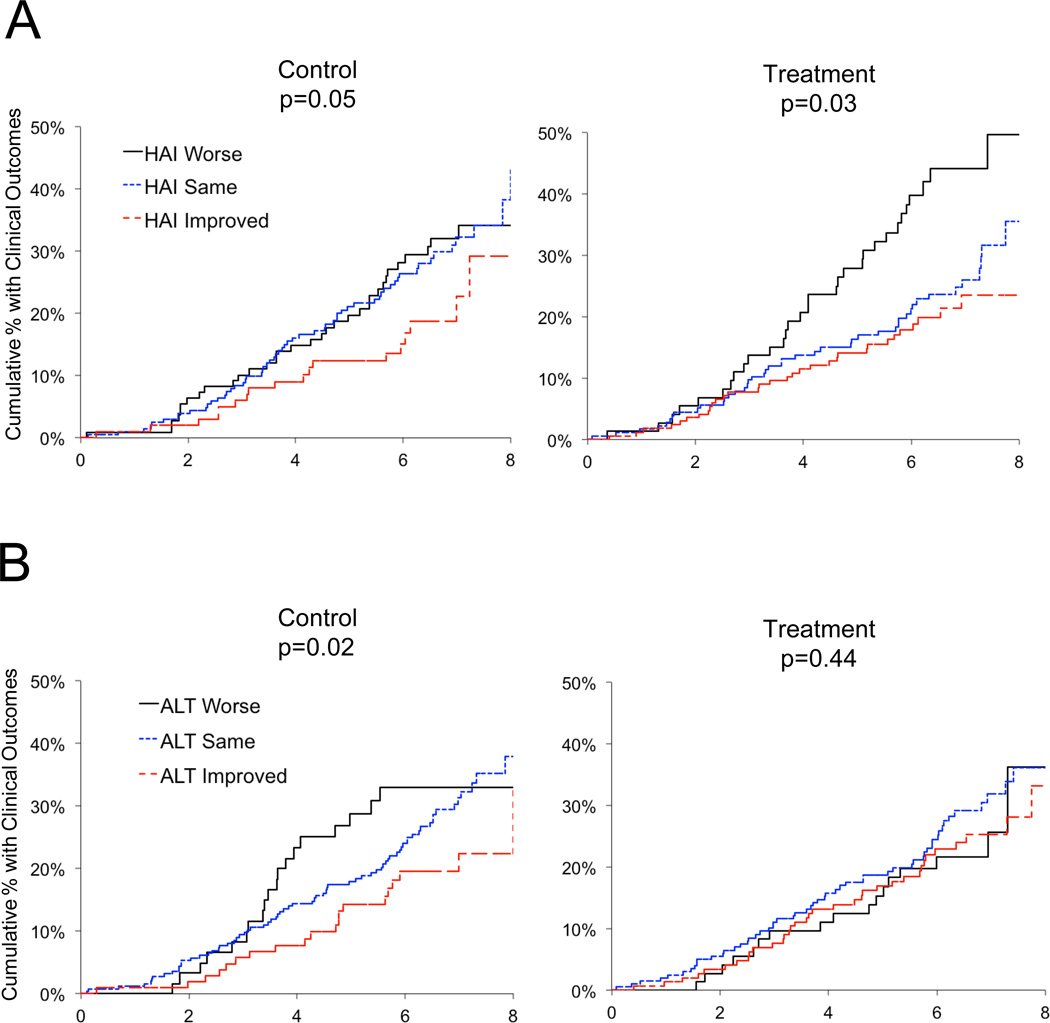
Figure 6. Decreased Frequency of Clinical Outcomes to Year 7 in Both Untreated Control and Treated Groups is Associated with Improvement in Hepatic Inflammation at Year 1.5.
The cumulative percentage of patients with clinical outcomes (defined in Materials and Methods) from Kaplan-Meier life table analyses are shown. Patients were categorized according to their randomized untreated control or treated status and the change in hepatic inflammation between baseline and year 1.5 (y-axis) (A) or change in serum ALT between baseline and year 1.5 (y-axis) (B). For panel A, sample sizes in the control group were: HAI worse (n = 109), HAI same (n = 203), HAI improved (n = 102) and in the treated group were: HAI worse (n = 73), HAI same (n = 178), HAI improved (n = 169). For panel B, sample sizes in the control group were: ALT worse (n = 61), ALT same (n = 248), ALT improved (n = 105) and in the treated group were: ALT worse (n = 73), ALT same (n = 200), ALT improved (n = 147). P values for differences among the three groups were derived from a Cox regression analysis for the control and treated groups evaluated separately.

