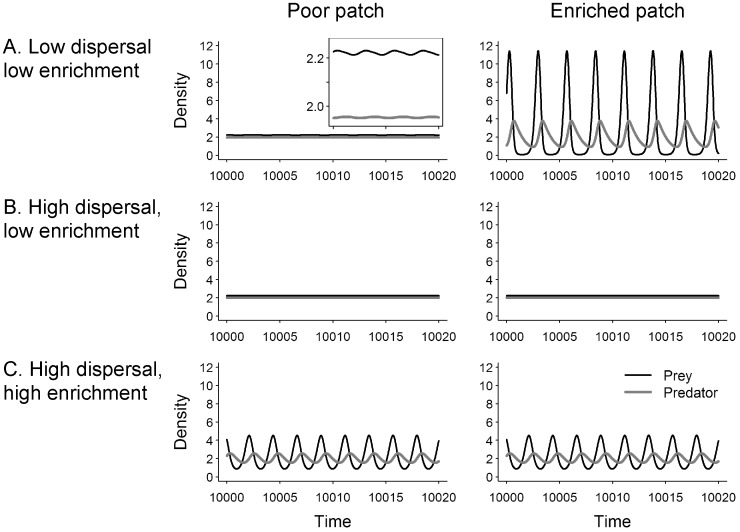
Figure 2. Examples of population dynamics of the prey (black) and of the predator (grey) when spatial heterogeneity is maximal (α = 1).
Metacommunities have two patches (M = 2), one poor patch (left column), where prey carrying capacity (K1) is kept constant, and one enriched patch (right column), where prey carrying capacity (K2 = K1+E) is increased. A. Low dispersal (dN = 0.001) and low enrichment (K2 = 30). B. High dispersal (dN = 1000) and low enrichment (K2 = 30). C. High dispersal (dN = 1000) and high enrichment (K2 = 40). These three cases correspond to the three points labeled respectively A, B and C on the panels of the Figure 3. Other parameters values: r = 10, K1 = 18.3, e = 0.1, a = 5, th = 0.01, m = 1, dP = dN.

