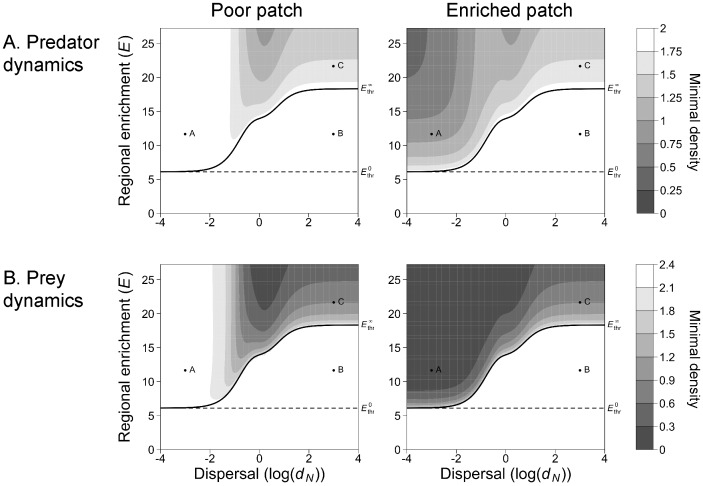
Figure 3. Effect of regional enrichment (E) and of dispersal rate (dN = dP) on the extinction risk when spatial heterogeneity is maximal (α = 1).
When enrichment is zero, the carrying capacities are equal to K
0 and they are below the stability threshold of an isolated patch. Regional enrichment (E) increases the carrying capacity in the enriched patch (K0+E), whereas the carrying capacity in the poor patch is kept constant (K0). The equilibrium of the two-patch metacommunity (M = 2) is stable below the black line. The minimal densities of the predator (A) and of the prey (B) in the poor patch (left column) and in the enriched patch (right column) are represented with grey levels. The higher the minimal density, the lower the extinction risk. At the three points labeled A, B and C, the population dynamics are illustrated in Figure 2. The solid lines then represent the enrichment threshold,  , for which the metacommunity is destabilized.
  and
and  denote the regional enrichment thresholds found analytically respectively for an isolated patch (dN = dP = 0) and for the well-mixed metacommunity (dN = dP = +∞). Parameters values: r = 10, K0 = 18.3, e = 0.1, a = 5, th = 0.01, m = 1.

