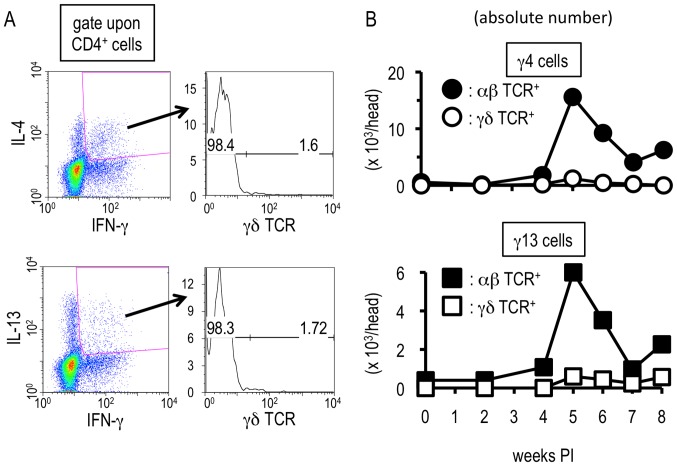
Figure 6. Hepatic αβ T cells are the responsible cells showing the unconventional cytokine profiles.
Hepatic lymphocytes were isolated from S. mansoni-infected mice and flowcytometry was conducted after TCR ligation. (A) Expression levels of γδ TCR on CD4+ γ4 cells or γ13 cells were analyzed with the hepatic lymphocytes isoleted at 6 weeks PI. The values in the right insets indicate percentages of γδ TCR-positive or –negative population in CD4+ γ4 or γ13 cells. This experiment is a representative of four independent experiments. (B) The absolute numbers of γ4 cells (upper graph) or γ13 cells (lower graph) in αβ TCR- or γδ TCR-potitive population were investigated. Similar results were obtained in three independent experiments.

